Top Trade Setups in Forex - UK Elections In Highlights

The U.S. indices closed higher on Friday, with the Nasdaq index hitting a record high. The Dow Jones Industrial Average rose 152 points (+0.6%) to 26,958, the S&P 500 added 12 points (+0.7%) to 3,022, and the Nasdaq Composite climbed 57 points (+0.7%) to 8,243.
Regarding U.S. economic data, final readings of the University of Michigan Consumer Sentiment Index posted 95.5 (96.0 expected). Later today, economists expect wholesale inventories to grow 0.3% on month in September (+0.2% in August).
European stocks were broadly higher, with the Stoxx Europe 600 gaining 0.2%. Germany's DAX edged up 0.2%, and France's CAC rose 0.7%.while the U.K.'s FTSE 100 was little changed at 7,324. The benchmark U.S. 10-year Treasury yield advanced to 1.796% from 1.768% on Thursday.
USD/JPY - Double Bottom Level In Focus
The USD/JPY closed at 108.665 after placing a high of 108.772 and a low of 108.509. The overall movement for the pair remained Bullish that day. At 19:00 GMT, the Revised US UoM Consumer Sentiment was released as 95.5 against the expectations of 96.0. The Revised UoM Inflation Expectations from the USA remained the same for this month at 2.5%. And at 23:00, the Federal Reserve Budget Balance showed a figure of 82.6B against the expectations of 83.5B. The budget data supported the US Dollar on Friday and caused an upward trend in USD/JPY.
Other than macroeconomic data, the risk factor remained in the market due to Brexit uncertainties and caused a rise in the prices of risky assets like USD/JPY on Friday.
The big news for that day was the Johnson calling for an election on 12th December, but Labour Party was not sounding keen of that which gave hints that the UK government has been planning to pull the Brexit deal off the table. On the Europe side, the EU was waiting to see some clarity between UK Parliament members before deciding to whether grant for an extension or not. This political impasse raised uncertainty over Brexit and the risk factor in the market.
Apart from Brexit, on Friday, Vice President Mike Pence commented on Hong Kong and China. He criticized the Chinese people over human rights and security and said that the United States stand with the protestors of Honk Kong. These comments from Vice President of the United States raised the chances of conflicts between China & the US, which are going to meet in the APEC Summit in Chile for signing the phase one deal. The risk-off scenario created a demand for USD/JPY on Friday.
-637078685033416489.png)
USD/JPY- Daily Technical Levels
| Support | Pivot Point | Resistance |
| 108.53 | 108.65 | 108.79 |
| 108.39 | 108.92 | |
| 108.13 | 109.18 |
USD/JPY- Daily Trade Sentiment
The technical view of the USD/JPY hasn't improved enough. The USD/JPY pair extends its trade-in tight trading area of 108.500 - 108.300. Nevertheless, it looks rather close to breaking this trading level.
Glancing at the 3-hour graph, the USD/JPY pair is trading under 20 periods EMA and has completed bearish engulfing, which are proposing chances of additional bearish bias. The USD/JPY may trade bullish above 108.65 to target 108.85 and 109 in case of the violation of this range,
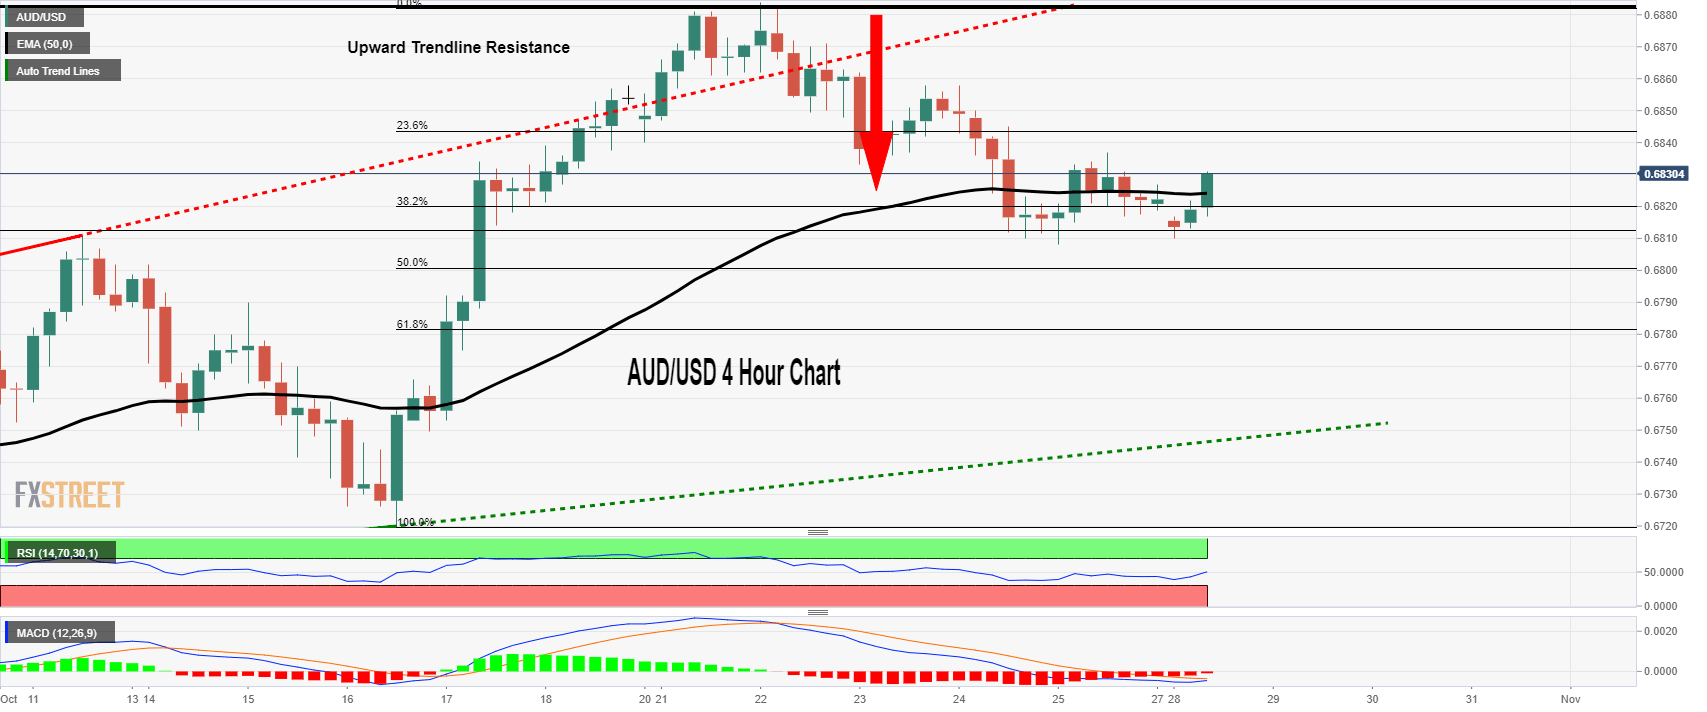
AUD/USD – 38.2% Fibonacci Retracement In-Play
The AUD/USD closed at 0.68196 after placing a high of 0.68359 and a low of 0.68092. The overall movement for the pair remained Bullish that day. In the absence of any macroeconomic release from Australia, the flow of Aussie remained dependant on US-China trade talks and US Dollar movement at the ending day of the week.
On Friday, the Chinese outlet named South China Morning Post reported that China and the United States of America had reached the agreement to keep the Yuan exchange rate stable. This will be part of the phase one deal, which will be signed by both parties in the APEC Summit in Chile.
According to a Reuters news release, there were also reports about China's plan to ask for the removal of tariffs in exchange for additional farm imports. Aussie will continue to follow the trend of US-China trade talks till Wednesday next week, at which the inflation report from Australia will be released and further decide the movement of pair AUD/USD.
AUD/USD - Technical Levels
| Support | Pivot Point | Resistance |
| 0.684 | 0.6849 | 0.6862 |
| 0.6828 | 0.687 | |
| 0.6806 | 0.6892 |
AUD/USD - Daily Trade Sentiment
The AUD/USD is holding precisely as we forecasted in the previous update. The pair is testing 38.% Fibo level at 0.6810. Since the Aussie has already completed 38.2% Fibonacci retracement at 0.6810, now we may see some buying in the AUD/USD area. At the same level, the 50 periods EMA is blocking the way of AUD/USD.
The breach of 38.2% Fibonacci retracement level may continue bearish inclination until 0.6800, the 50% Fibo level. Let's look for selling trades below 0.6849 area to target 0.6800 today.
USD/CAD - Choppy Session Begins
The USD/CAD closed at 1.30590 after placing a high of 1.30766 and low of 1.30558. The overall movement for the pair remained Bearish that day. There was no macroeconomic data release from Canada on Friday, which moved USD/CAD dependant on US Dollar and Crude Oil Prices.
The USD/CAD went into the consolidation phase on Friday after giving a 3-months low on Thursday. It was seen to be moving in a tight range throughout the ending day of the week.
The Crude Oil Prices raised last week due to the expectations of sharp cut from OPEC and its allies and the drop in US stocks of Oil this week. The per barrel of crude oil jumped to $56 last week.
Rising crude oil prices made the commodity-linked Loonie outperform its rival currencies and put pressure on USD/CAD prices at the ending day of the week.
The drop in USD/CAD was further added due to pressure on the US Dollar on Friday. US Dollar remained range-bound due to upcoming fed meeting f October. The 3rd rate cut is expected in this meeting, which has weighed US Dollars throughout the week.
-637078685584993296.png)
USD/CAD - Technical Levels
| Support | Pivot Point | Resistance |
| 1.307 | 1.3103 | 1.3125 |
| 1.3049 | 1.3158 | |
| 1.2994 | 1.3213 |
USD/CAD - Daily Trade Sentiment
The USD/CAD is binding in a bearish channel, which is prolonging hurdle around 1.3100, the psychological mark. The speed of a sell-off is a bit lazy, but the trend yet appears bearish.
The leading indicators such as the RSI and MACD have recorded the bullish zone, but evidently, it's because of the bullish retracement in the pair. The USD/CAD may trade bearish below 1.3103 and bullish over 1.3030 today. All the best for the U.S. session!
Author

EagleFX Team
EagleFX
EagleFX Team is an international group of market analysts with skills in fundamental and technical analysis, applying several methods to assess the state and likelihood of price movements on Forex, Commodities, Indices, Metals and


