Litecoin stays bullish ahead of Litepay launch, expected on 26th Feb
- Litecoin reaches 12.50 billion dollars capitalization after profiting from good news
- BTC/USD rejected to the downside at $9971, but still fighting to climb higher

BitPay to implement its LitePay platform, offer paying cards in Litecoins
LTC/USD skyrocketed a whooping 30% yesterday after BitPay announced that it will develop LitePay, a payment app based in Litecoin. This announcement has outweighed the denial by Charlie Lee, Litecoin's founder, of a rumored fork to develop Litecoin Cash.
We proposed a bullish target of $204 yesterday, a level that was easily surpassed during the American session. The technical picture has radically changed for Litecoin, and now looks to be supporting a new bullish leg in the mid-term. LTC/USD is now trading around $230, very close from the $239.8 mark where the 50% Fibonacci retracement from the downmove is sitting. If that levels gets broken, next target will be at $257, slightly below the key 61.8% Fibonacci retracement located at $271.62.
Below, the first support is at $214.36, followed by a more important support at $206.88 which matches the 38.2% Fibonacci retracement. If that level is lost, LTC/USD price action would unload the current bull ride and the technical outlook would favor the bears, taking the price back to $167.
LTC/USD daily chart
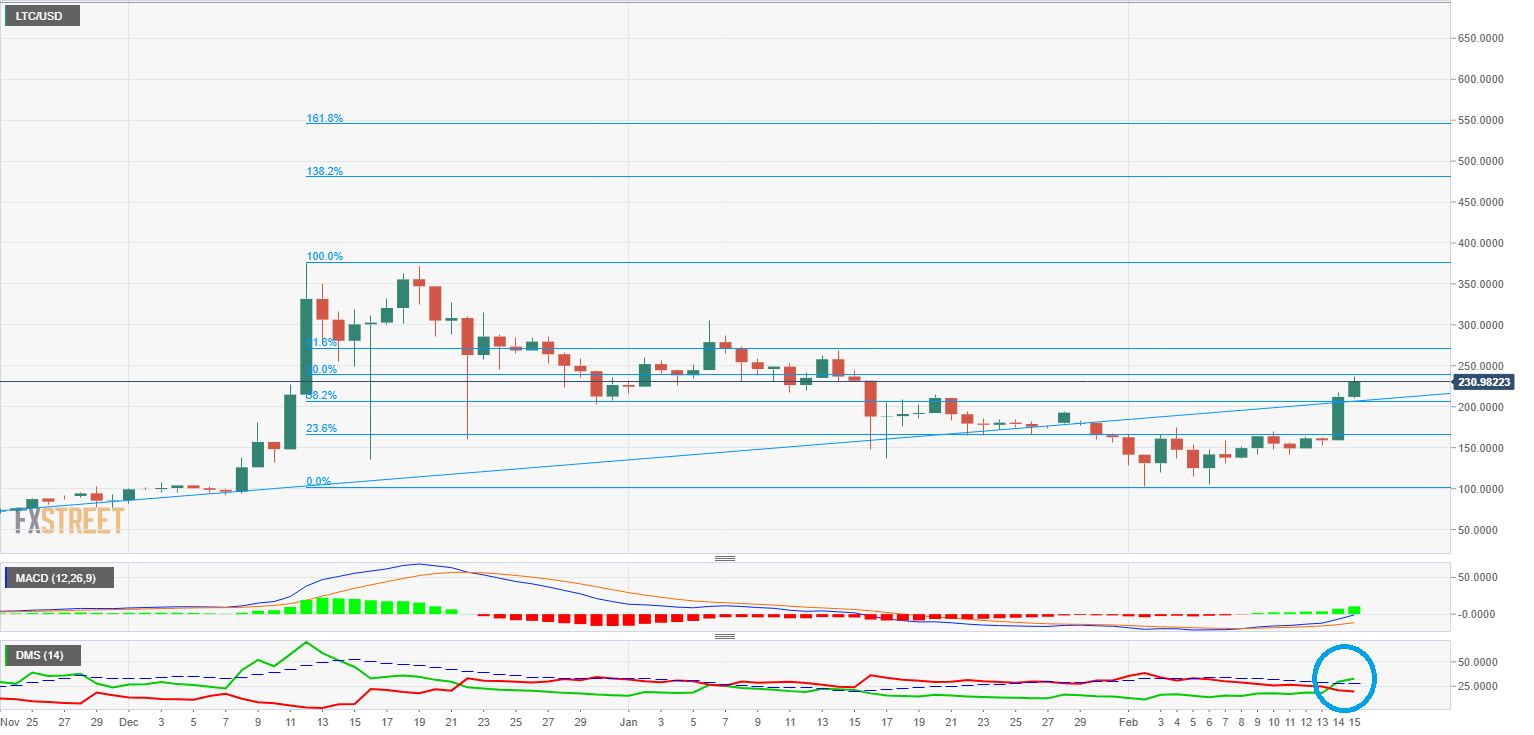
MACD is crossed to the upside in the Litecoin daily chart, having reached an opening and inclination much more favorable to the continuation of the bullish movement. Anyway, the indicator is so close to the 0 mark that there is a considerable degree of difficulty to breaking it in the short-term. That could match the arrival to the 50% Fibonacci retracement of the whole bearish move.
Directional Movement Index is very positive, with the D+ overcoming the ADX line, a very bullish situation that won't be reverted unless these indicators are crossed down again.
Bitcoin acting as the senior Cryptocurrency, advancing with steady gains
Bitcoin kept the general tone in the Crypto board and advanced more than 6% yesterday, reaching the $9500 mark. BTC/USD is now trading around a meaningful resistance level at $9971, a level where several candles set their daily lows. The resolution of this technical situation will define trading in the upcoming sessions. It looks like the first attempting of a bullish breakout has failed and Bitcoin price has been rejected to the downside, sending the price back to $9500. First support level is at $9493, followed by $9376. Main support is at $9172.
On the upside, if BTC price breaks above $9971, next target would be at $10332, followed by $10861. Last, but not least, a bigger resistance is awaiting at $11219, the 38.2% Fibonacci retracement of the whole fall from the all-time highs.
BTC/USD daily chart
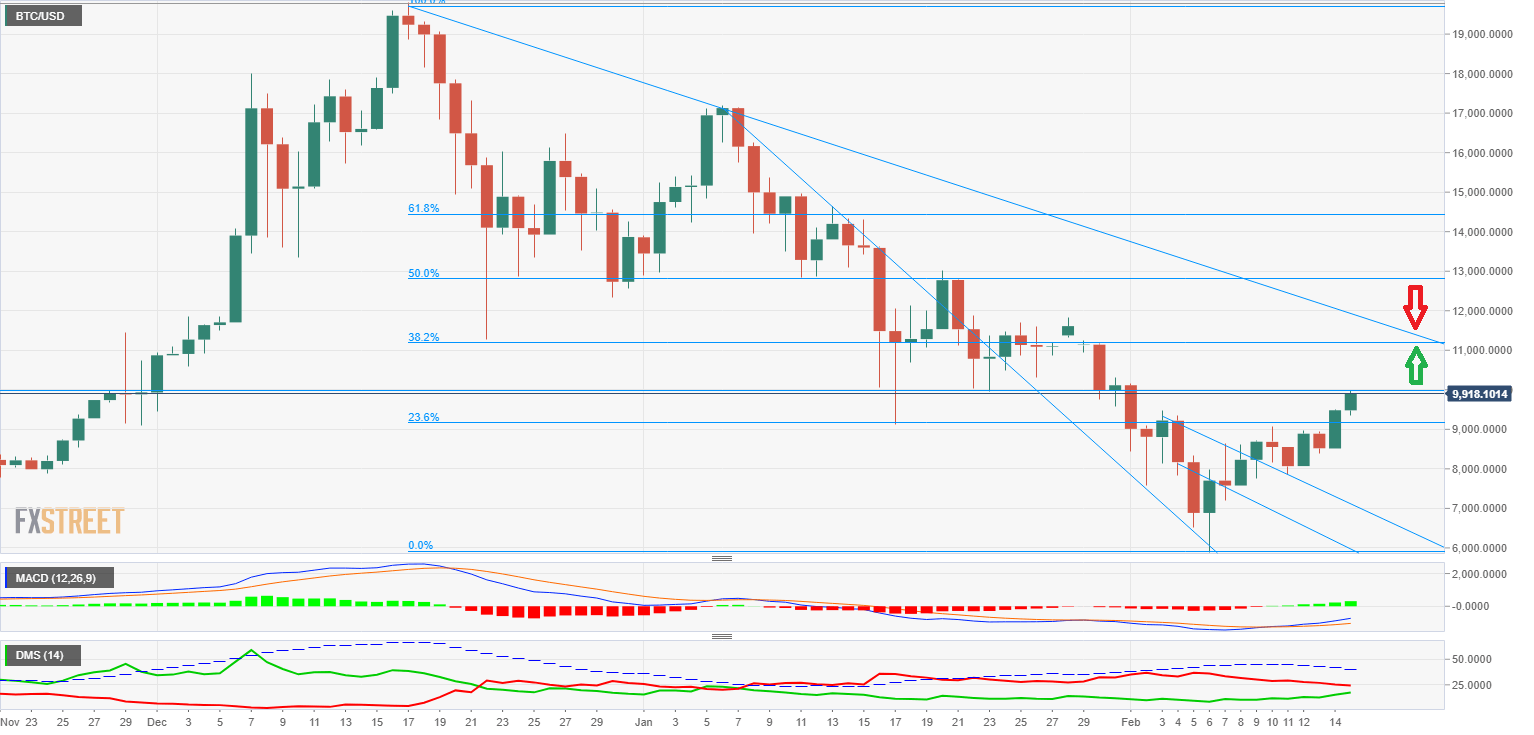
MACD in the Bitcoin daily chart has an improved outlook, having found a better angle and inclination, and finding room to develop to the upside, although it still needs to break above the 0 level. Such a breakout would match the moment where BTC price meets the major trendline coming from all-time highs that is ruling the bearish movement.
Directional Movement Index is not finding itself in such a good position as Litecoin, with sellers still in control, although the arrival of new buyers is still important and is proposing a continuation. ADX is still retracing, so don't disregard any bearish testing movements.
Ripple stuck around $1.1381, looking for an easier path to keep rising
Ripple tried in vain to break above the $1.138 and now seems to be looking for a less steep trend that allows it make progress. First support is at $1.039, and if that one is breached it would open the doors to $0.98 as the next target.
On the upside, if XRP/USD price action recovers strength and tries new bullish legs, the first clear resistance is at the forementioned $1.138 level. Next target will be at $1.1633 and the most important resistance looks to be set at $1.2268, the February 10th high located in a clear congestion area.
XRP/USD 4h chart
-636542902207015345.png)
MACD in the Ripple chart is in a very similar situation as the Bitcoin, although it still is trying to regain steam after being the first major Cryptocurrency to initiate the current bullish movement last week.
Directional Movement Index shows a very slight edge to the buyers, an advantage not big enough to trigger any kind of bullish action. ADX is not showing any increase of the trend strength, so more erratic price action with no clear direction looks like the most probable scenario.
Author

Tomas Salles
FXStreet
Tomàs Sallés was born in Barcelona in 1972, he is a certified technical analyst after having completing specialized courses in Spain and Switzerland.


