Top 3 crypto price prediction: Bitcoin and Litecoin break the forecasts, Ripple in danger
- BTC and LTC rise and break the bearish trend. Upwards scenario confirmed if prices are kept at the end of the day.
- XRP distances and does not resolve its current situation.

Bitcoin and Litecoin awake in Europe with rises and begin a new bullish setting
After two months of deep downwards movement, it seems that money is flowing again with decision towards the main cryptos. Despite some analysis weakened the bullish forces of the past sessions, BTC/USD and LTC/USD have caught many by surprise with a clear upwards move that have surpassed the former bearish trends and opens the door to new rising impulses. It is, however, not a homogeneous move, since Ripple has been left behind and is now waiting for more money to come.
BTC/USD 240 min
You can't win a battle until the combat has ended, so any new scenario has to be confirmed in today's American session closings. The move has also served for breaking the 61.8% Fibonacci level of the whole bearish trend.
Bitcoin is trading on the early American session at $11,444.08, above the main trendline from mid-December. A key level to watch out is $11,330, that has become the main support, since a downwards break would make the previous move useless and send a clear weakness message.
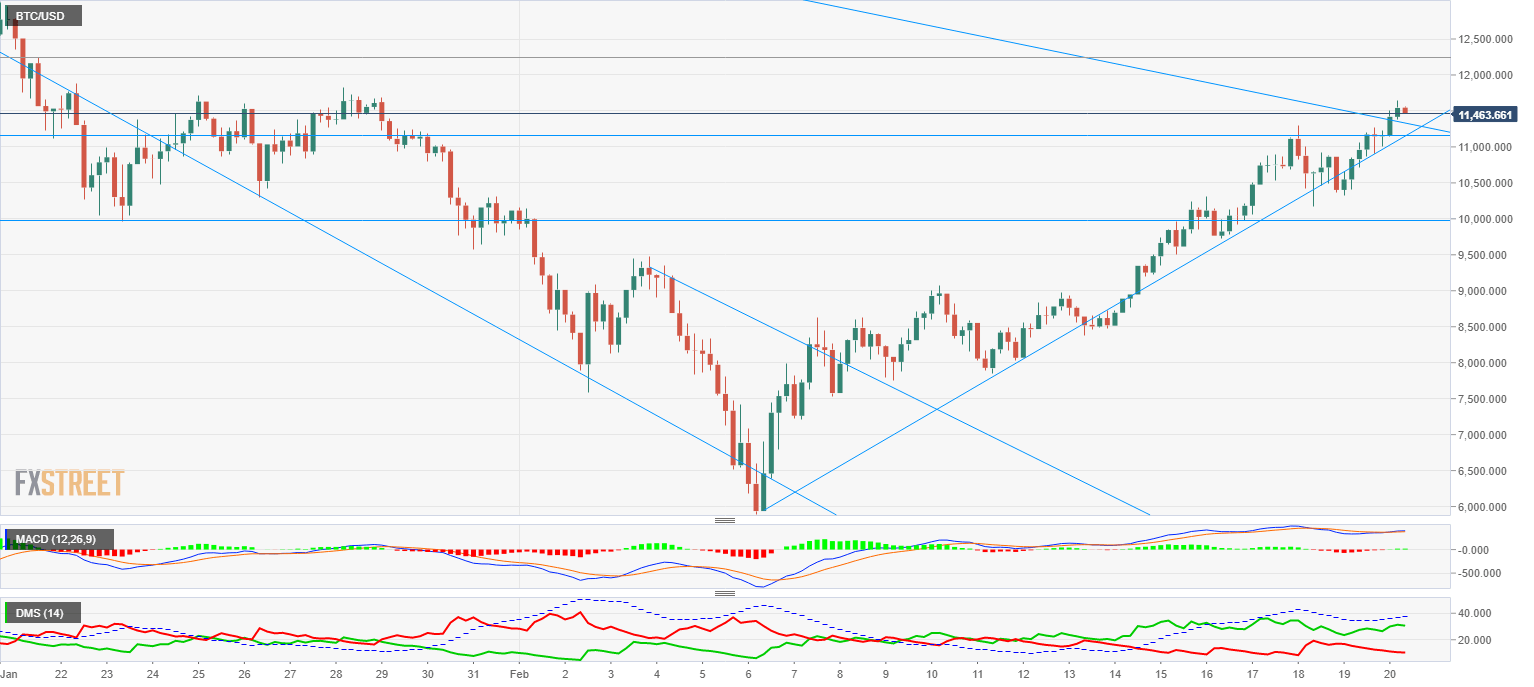
The MACD has recovered, with new upward slope but almost no line openings. We can't dismiss a try of the recently surpassed level if a wider move doesn't consolidate the new setting.
The Directional Movement Index is clearly showing the sales weakening, while the purchases maintain a level similar to the previous days. The indicator highlights that the recent move is due to a supply withdrawal rather than a demand increase.
Above, the first resistance is found at $11,863, followed by $12,397 and a third resistance level in a confluence zone between the 50% retreat level at $12892 and $13,014, January 20 relative high and neckline of the head and shoulders bottom pattern.
Below, the first support is at $11,348, followed by the 61.8% retreat level at $11,252. Finally, as an operative stop, we can consider the minimum of the candlestick just before the bullish break, at $11,149.056.
LTC/USD 1D
Strong upwards move in Litecoin's price during the first European session hours. It has broken the 50% Fibonacci retreat mark, a level that has kept testing and whose result will determine the session's outcome. The technical structure is different to Bitcoin's, which leads to more bullish predictions.
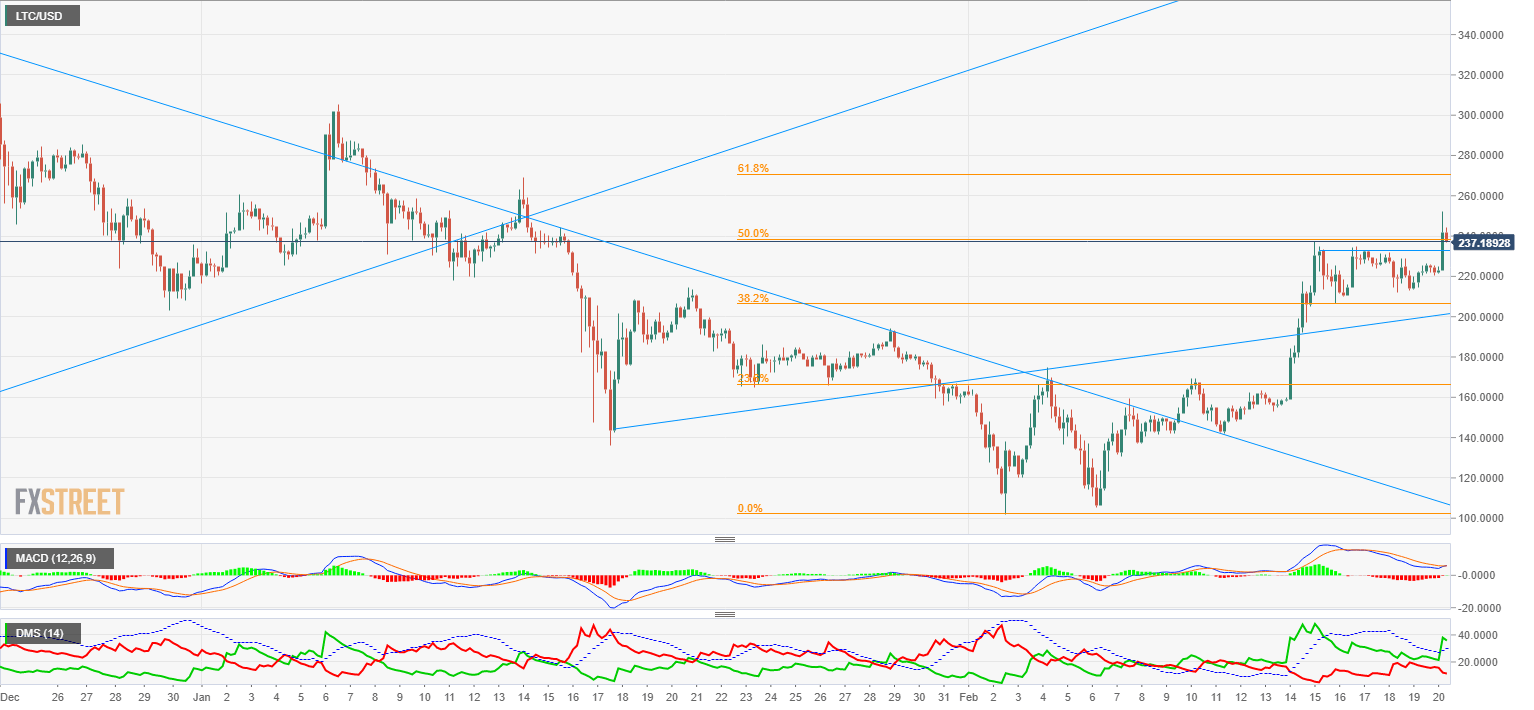
The MACD is almost crossed to the up, with a good looking angle. We must wait to have more meaningful data, but the scenario looks promising for new rises.
The Directional Movement Index is much clearer, with an important increase of purchase forces while the sales decrease slightly. The D+ is above the ADX and suggests more rises. In contrast to Bitcoin, for Litecoin the rise has been driven by an increase of purchasers.
Above, there is a first resistance at $259.89, very close to the next obstacle, the 61.8% retreat level at $270.80.
Below, there is an important support at $238.53, where the 50% Fibonacci retreat level stands. It must be kept at closings for Litecoin to confirm the rise. If the first support is broken, the 38.2% level stands at $206.36.
XRP/USD 240 min
Ripple's price keeps moving in a highly congested, narrow zone, which makes any outcome possible. Since the upward trendline from the February 6 was lost, the situation has worsened and Ripple has almost no reaction margin.
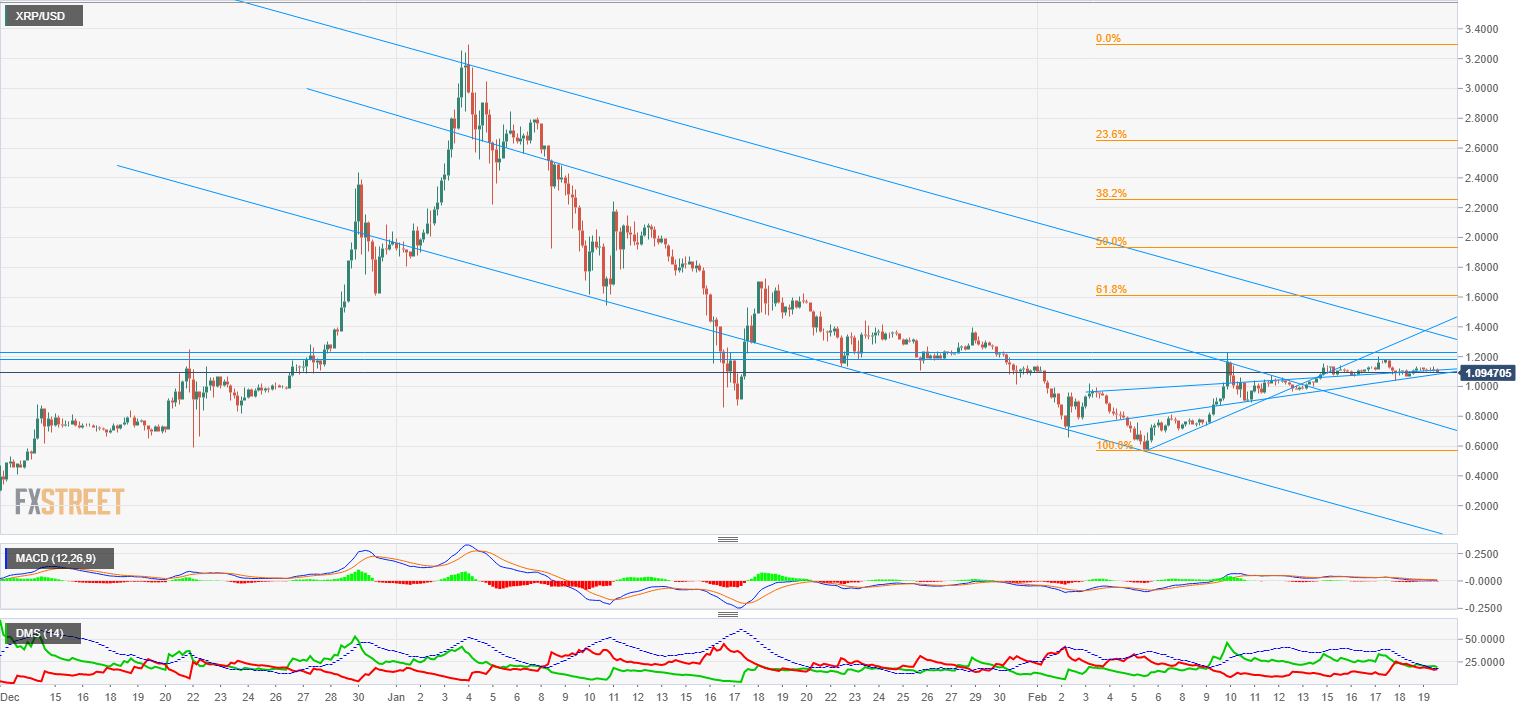
The MACD keeps laying on the equilibrium, without any sign of future intentions. The only good news is that it is still in the positive zone.
The Directional Movement Index is also displaying the indecision of buyers and sellers.
Above, there is a first goal at $1.1780, followed by $1.2283. If broken, Ripple would face a contrived structure of resistances between $1.31 and $1.46.
Below, the first key support to keep any bullish hopes is at $1.08, followed by $0.96. If lost, free room until the downwards trendline at $0.72.
Author

Tomas Salles
FXStreet
Tomàs Sallés was born in Barcelona in 1972, he is a certified technical analyst after having completing specialized courses in Spain and Switzerland. He expanded his technical training following the guidance of great experts on the financial markets.