Ripple doesn't react and moves away from main cryptocurrencies

Ripple continues its downhearted journey, locked up in a contrived technical setting that signals laterality from the February 10 relative maximum.

XRP/USD 240 min

Ripple experienced a new low volatility session, enclosed in a small range of cts/$. It is very close to a key support at $0.90, where the price rested after the heavy January losses. That level became the shoulder of a H&S pattern, and losing it would be dreadful news for Ripple's price.

The MACD confirms the lack of a clear trend. It is very flat, it is moving slightly below the 0. The most likely scenario is a continuation of the lateral, narrow range move tending to decrease.

The Directional Movement Index shows the sellers on control, but it is developing a pattern that tends to end up with the buyers regaining control. If this happened at $0.90, it would be a strong bullish signal.

Above, the first resistance is at $1.06, followed by $1.14. The third level is at the relative maximum $1.226.

Below, the $0.90 level, followed by $0.728. If lost, the next one is the February 6 minimum at $0.569.

Bitcoin and Litecoin face similar challenges

Bitcoin is at the time of writing at $10,300, and continues the downwards move started on late Monday, which will lead it to $10,000 very soon. This is a key technical level, because it is the shoulder of the January's H&S pattern. Litecoin and Ethereum are in equivalent settings and developing similar movements.

BTC/USD 240 min

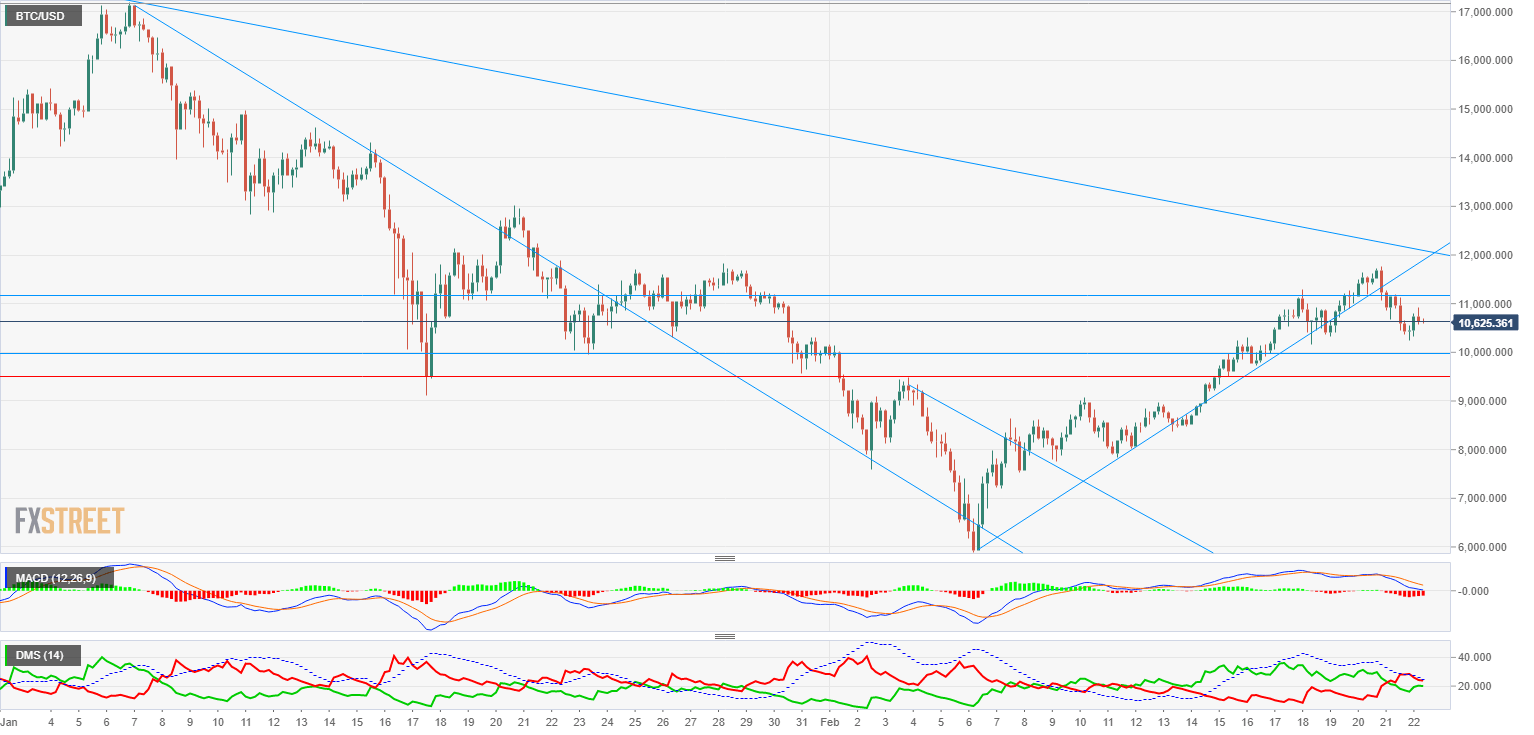
The MACD shows a downwards but positive trend. There is room between line and signal, so we can't dismiss it to become negative, something that would speed up losses.

The Directional Movement Index favors sellers, although the purchases level is quite high. The D- is above the ADX, a signal that strengthens the bearish potential.

Above, the first goal is at $11,117, followed by $12,000. If broken, Bitcoin would enter a definite bullish trend.

Below, the first support is at $10,000. If lost, the next levels are $9,500 and $8,980.

LTC/USD 240 min

Litecoin is in a better technical environment, despite it is facing the bottom of the small upwards channel where it stands. At the time of writing, it is at $207.52, with the channel's support at $204.95. This level is the 38.2% Fibonacci retreat.

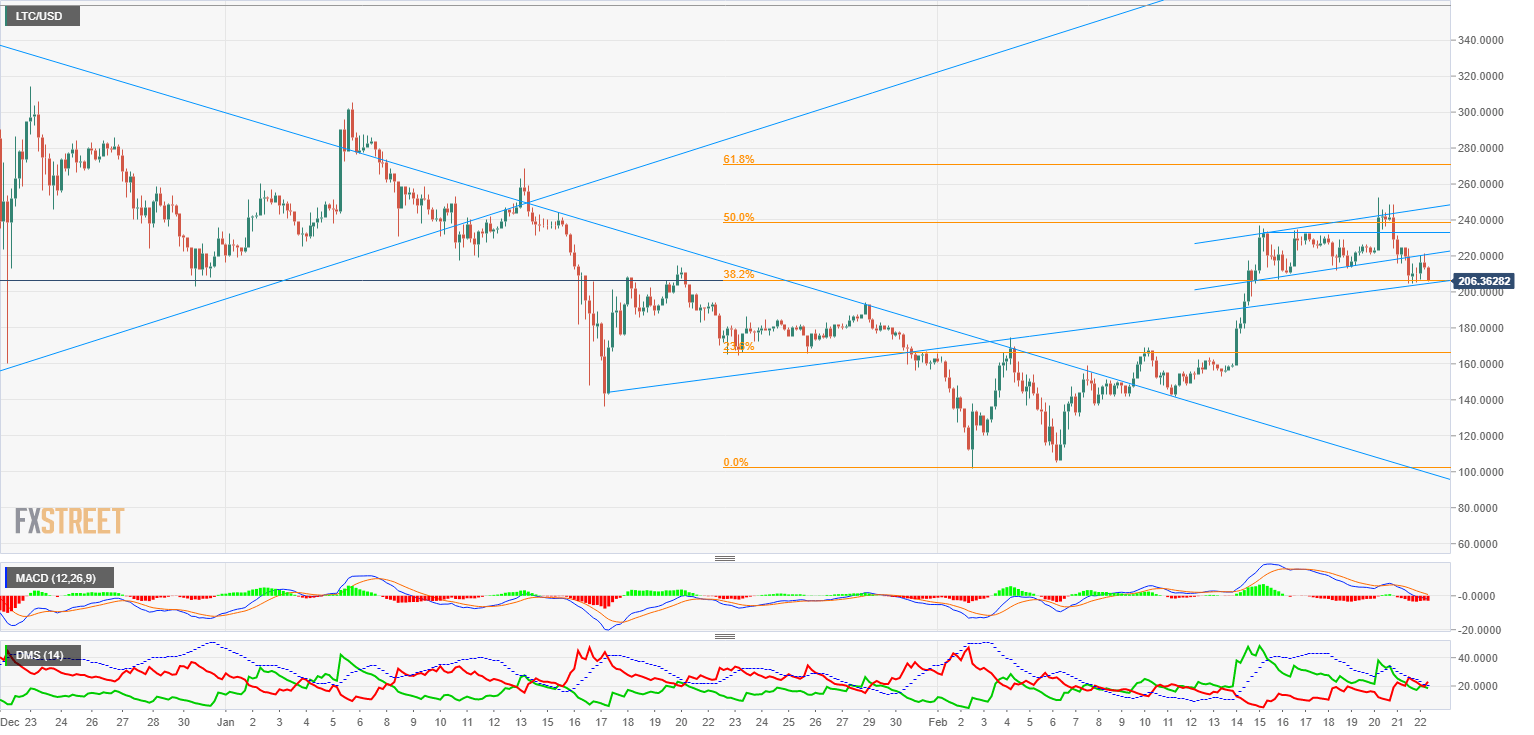
The MACD is more favorable than Bitcoin's. Despite the downward trend, it is positive and its curvature suggests a possible upwards turn.

The Directional Movement Index shows total equilibrium between sales and purchases and supports the 'potentially bullish neutrality' analysis.

Above, the first resistance to meet is at $222.75, followed by $238.87.

Below, the first support stands at $204.95. If lost, the next ones are at $175.45 and $152.68.

Information on these pages contains forward-looking statements that involve risks and uncertainties. Markets and instruments profiled on this page are for informational purposes only and should not in any way come across as a recommendation to buy or sell in these assets. You should do your own thorough research before making any investment decisions. FXStreet does not in any way guarantee that this information is free from mistakes, errors, or material misstatements. It also does not guarantee that this information is of a timely nature. Investing in Open Markets involves a great deal of risk, including the loss of all or a portion of your investment, as well as emotional distress. All risks, losses and costs associated with investing, including total loss of principal, are your responsibility. The views and opinions expressed in this article are those of the authors and do not necessarily reflect the official policy or position of FXStreet nor its advertisers. The author will not be held responsible for information that is found at the end of links posted on this page.

If not otherwise explicitly mentioned in the body of the article, at the time of writing, the author has no position in any stock mentioned in this article and no business relationship with any company mentioned. The author has not received compensation for writing this article, other than from FXStreet.

FXStreet and the author do not provide personalized recommendations. The author makes no representations as to the accuracy, completeness, or suitability of this information. FXStreet and the author will not be liable for any errors, omissions or any losses, injuries or damages arising from this information and its display or use. Errors and omissions excepted.

The author and FXStreet are not registered investment advisors and nothing in this article is intended to be investment advice.

Recommended Content


Recommended Content

Editors’ Picks

EUR/USD stays below 1.0700 after US data

EUR/USD stays below 1.0700 after US data

EUR/USD stays in a consolidation phase below 1.0700 in the early American session on Wednesday. The data from the US showed a strong increase in Durable Goods Orders, supporting the USD and making it difficult for the pair to gain traction.

EUR/USD News

USD/JPY refreshes 34-year high, attacks 155.00 as intervention risks loom

USD/JPY refreshes 34-year high, attacks 155.00 as intervention risks loom

USD/JPY is renewing a multi-decade high, closing in on 155.00. Traders turn cautious on heightened risks of Japan's FX intervention. Broad US Dollar rebound aids the upside in the major. US Durable Goods data are next on tap. 

USD/JPY News

Gold trades on the back foot, manages to hold above $2,300

Gold trades on the back foot, manages to hold above $2,300

Gold struggles to stage a rebound midweek following Monday's sharp decline but manages to hold above $2,300. The benchmark 10-year US Treasury bond yield stays in the green above 4.6% after US data, not allowing the pair to reverse its direction.

Gold News

Worldcoin looks set for comeback despite Nvidia’s 22% crash Premium

Worldcoin looks set for comeback despite Nvidia’s 22% crash

Worldcoin price is in a better position than last week's and shows signs of a potential comeback. This development occurs amid the sharp decline in the valuation of the popular GPU manufacturer Nvidia.

Read more

Three fundamentals for the week: US GDP, BoJ and the Fed's favorite inflation gauge stand out Premium

Three fundamentals for the week: US GDP, BoJ and the Fed's favorite inflation gauge stand out

While it is hard to predict when geopolitical news erupts, the level of tension is lower – allowing for key data to have its say. This week's US figures are set to shape the Federal Reserve's decision next week – and the Bank of Japan may struggle to halt the Yen's deterioration. 

Read more

Majors

Cryptocurrencies

Signatures