The US Dollar Index just hit new 2026 highs above 102.20 – This chart shows the runaway move
Major currency trading hasn't been the most interesting asset class over the last 18 months. Outside the unwinding of the massive carry trade in USD/JPY, most major pairs have been confined within tight ranges and short-lived swings. The US Dollar Index (DXY), which tracks the weighted performance of the US Dollar against a basket of currencies, has been simmering inside a range between 95 and 102 during that period. Not anymore.
On Thursday, DXY broke above 102 for the first time since April 10, 2025, the week after Liberation Day. Remember Donald Trump reading out tariff rates to every country in the world, driving foreign hedge funds to pull out of US stocks and the US Dollar?
So long, de-dollarization. The US Dollar is back in the driver's seat now. Thursday's high could mark the start of a Greenback uptrend going into the last quarter of the year.
What's driving the rise of the US Dollar?
The surge in US Treasury yields has been front and center in the market's attention over the past month. The US 10-year Treasury yield rose on Thursday to 5.33%, a level not seen since 2007.
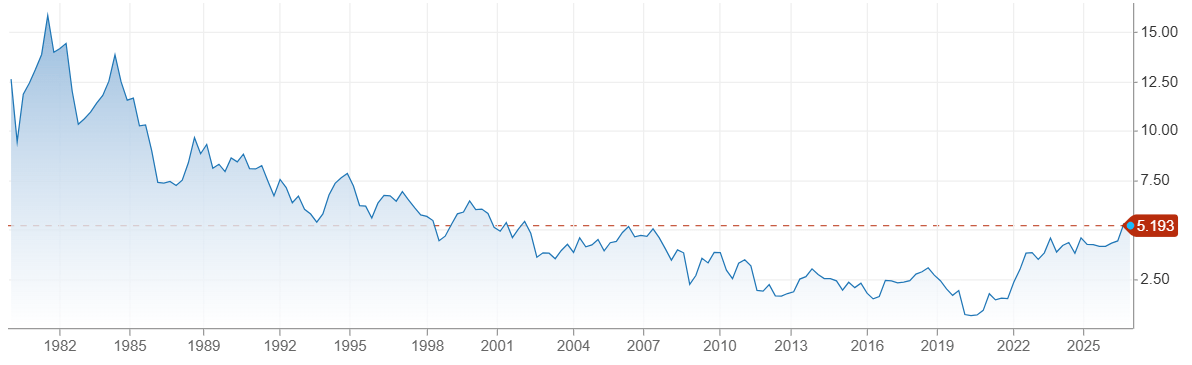
Demand for government bonds is weak these days, with large sums of capital flowing into AI capex and tech stocks. Surging prices of Crude Oil and its derivatives are making inflation impossible to ignore for central bankers, who months ago were expecting to cut, not hike, interest rates into year-end. Although these developments are common across major economies, the US Dollar is coming out on top among G10 FX currencies, maintaining its status as the world's reserve currency and making it more appealing in times of high uncertainty.
This week, the Eurozone's inflation data for September printed a 3.8% YoY rise, beating consensus expectations of 3.6%. On the other side, US data was soft both in inflation, with US Core PCE printing a 3.0% YoY (vs 3.3% expected) and Nonfarm Payrolls adding just 29K jobs in September – plus downward revisions in last month's figures. Odds for a Fed rate hike in October fell from the mid-70s at the start of the week to below 30% at the time of writing. Still, EUR/USD failed to rally on this divergence, continuing to fall below 1.1300 toward 17-month lows. This suggests something is odd here.
Is it just the French fiscal crisis damaging the Euro's credibility? Or is there something else on the Dollar side?
What do major banks say about the Greenback strength?
Analysts at ING note that Friday's pullback in US 10-year Treasury yields – which have pulled back to 5.20% at the time of writing – has been helped by a shift in Fed rhetoric, with Vice Chair Philip Jefferson “echoing remarks from John Williams earlier in the week that the Fed should not rush into back-to-back rate hikes.” They highlight that “pricing for a Fed hike in October has now dropped to just 28% from 70% a week ago,” and suggest that “it looks like the market is going to settle into the view that the next hike comes in December.”
Despite this near-term repricing, strategists at BBH point out that “USD is up across the board, with the DXY index making new cyclical highs.” In their view, “resilient US economic activity, improving labor demand, and sticky inflation back the nearly 100 bps of Fed funds rate hikes priced over the next twelve months.” BBH adds that “USD gains are tracking widening US-G6 interest rate differentials,” and while “tightening by other major central banks limits policy divergence with the Fed,” they argue that “US economic growth outperformance and strong foreign appetite for US securities can keep USD risks skewed to the upside.”
King Dollar on the run? Staying above Double Top support will go a long way
In the daily chart, the US Dollar Index trades at 101.69 at the time of writing.
DXY has formed a bullish crossover between the 20-day moving average (MA) at 100.34 and the 100-day MA at 100.14, a strong bullish signal. Despite the post-NFP dip, the near-term bias stays bullish as price stretches into the upper half of the Bollinger envelope. The fact that the Bollinger Bands are expanding their range, bending the confines of the USD Index without breaking them, reinforces underlying demand. Momentum remains firm, with the Relative Strength Index (RSI) at 69.14, flirting with overbought territory and hinting that the advance is strong, but not overstretched.
The broken Double Top pattern from June and July places immediate support at 101.70. If the US Dollar Index can close the week above that level, it will provide another strong bullish signal to break out of the last 18 months’ range. On the topside, immediate resistance is seen at the horizontal barrier around 101.77, ahead of the Bollinger upper band near 102.38.
On the downside, initial support aligns with the Double Top. If that is broken, relevant supports come in the form of the 20-day MA and Bollinger middle band clustered around 100.34, followed by the 100-day MA at 100.14.
(The technical analysis of this story was written with the help of an AI tool. Know more.)
Author

Jordi Martínez
FXStreet
Jordi Martínez is the Editor in Chief at FXStreet, leading editorial operations at the company, before being promoted to the role in 2023, he worked in several editorial positions at FXStreet, including roles as Senior Editor and

















