EUR/USD Weekly Forecast: EU inflation outpaces US price growth as ECB, Fed meetings loom
- European inflation surprised, rising more than anticipated at the end of Q3.
- The United States PCE Price Index brought relief at 3.4% YoY in September.
- EUR/USD could test the 1.1000 psychological threshold in a matter of days.

The US Dollar (USD) had yet another positive week, appreciating sharply against most of its major rivals. The EUR/USD pair fell for a fourth consecutive week and traded as low as 1.1215, a level last seen in May 2025. As the weekend approaches, the pair hovers around 1.1280 as the US Dollar Index (DXY) eases from an over one-year high.
United States economic resilience
The United States (US) economic resilience is out of the question. The USD surged after a batch of first-tier macroeconomic data showed that growth continues, the labor market is pretty healthy, and inflation is stable. For sure, softer price pressures are preferable, but on that particular front, no bad news is good news.
Market participants learned on Wednesday that annualized growth, as measured by the Gross Domestic Product (GDP), was upwardly revised to 2.2% in Q2 from the previous estimate of 1.5% . Also, the Personal Consumption Expenditures (PCE) Price Index, the Federal Reserve (Fed) favorite inflation gauge, came in softer than anticipated in August, holding at 3.4%, while the July reading was downwardly revised from 3.7% to 3.4%. Above the ideal 2% yet below this year’s peak of 4%.
On the same day, ADP reported that the private sector added 90K new jobs in September, better than the 70K anticipated by market participants. The country added a measly 29K new jobs in September, much worse than the 90K expected, according to the Nonfarm Payrolls report. August figure was downwardly revised to 133K from a previous estimate of 162K. Also, the Unemployment Rate edged higher to 4.2% in the month, while the Labor Force Participation Rate rose to 61.8% from 61.6%. Finally, annual wage inflation, as measured by the change in Average Hourly Earnings, increased by 3% on a yearly basis, coming in below analysts' estimate of 3.2%.
While soft, the figures were far from concerning, yet a less tight labor market leans the scale towards lower interest rates, adding to early speculation that the Fed will refrain from hiking in October.
US data impact on the Federal Reserve
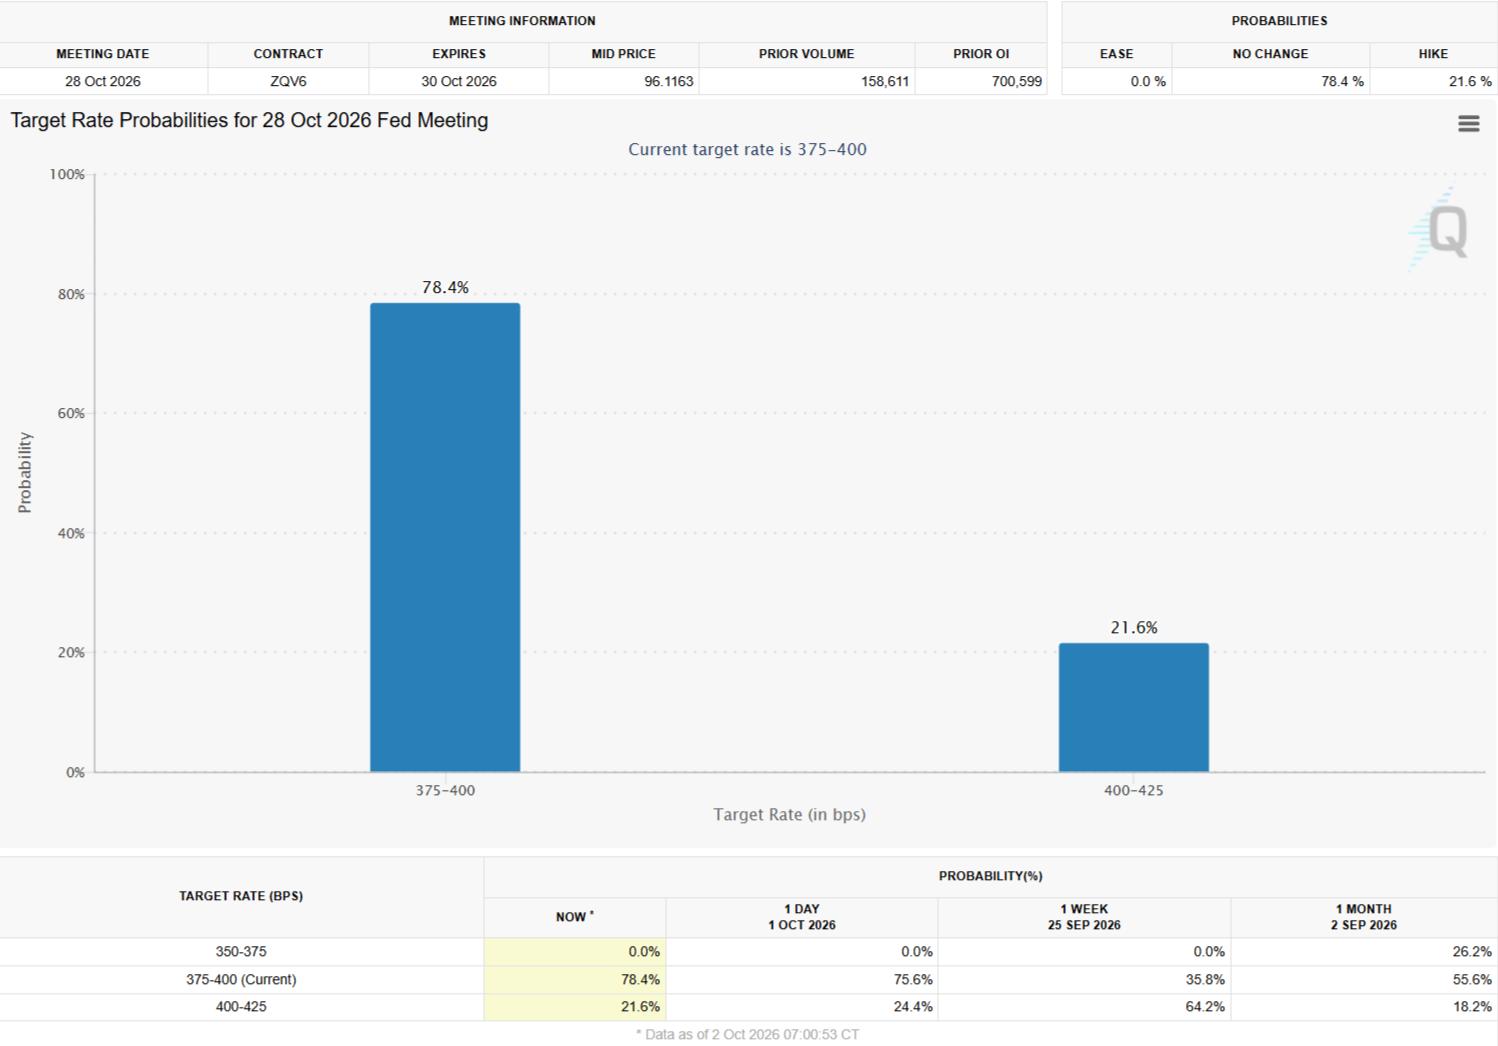
Data has not only proved US economic resilience, but also affected market bets on future Fed monetary policy decisions. Following the softer-than-anticipated PCE Price Index, market players rushed to take back bets on an October interest rate hike. The odds of a rate hike announcement on October 28 have decreased to around 21% from a peak above 70% in the previous week.
So, why does the USD remain strong?
The weekly rally and Friday’s pullback could be explained by government bond yields ' behavior. The 10-year Treasury note yielded as much as 5.3%, a multi-decade high mid-week. Following the NFP release, the 10-year yield fell to 5.1 5%. Generally speaking, higher yields boost demand for USD-related assets. There’s, however, a caveat: surging long-term yields are usually the result of mounting inflation concerns.
So, while investors are still worried about higher inflation, they still believe the American economy will outperform those of its peers.
What’s up with Europe?
The Euro is weak, despite the European Central Bank (ECB) grabbing the bull by the horns earlier: the ECB hiked interest rates twice so far this year, and investors see at least one more hike before the year is over, and three more hikes through 2027.
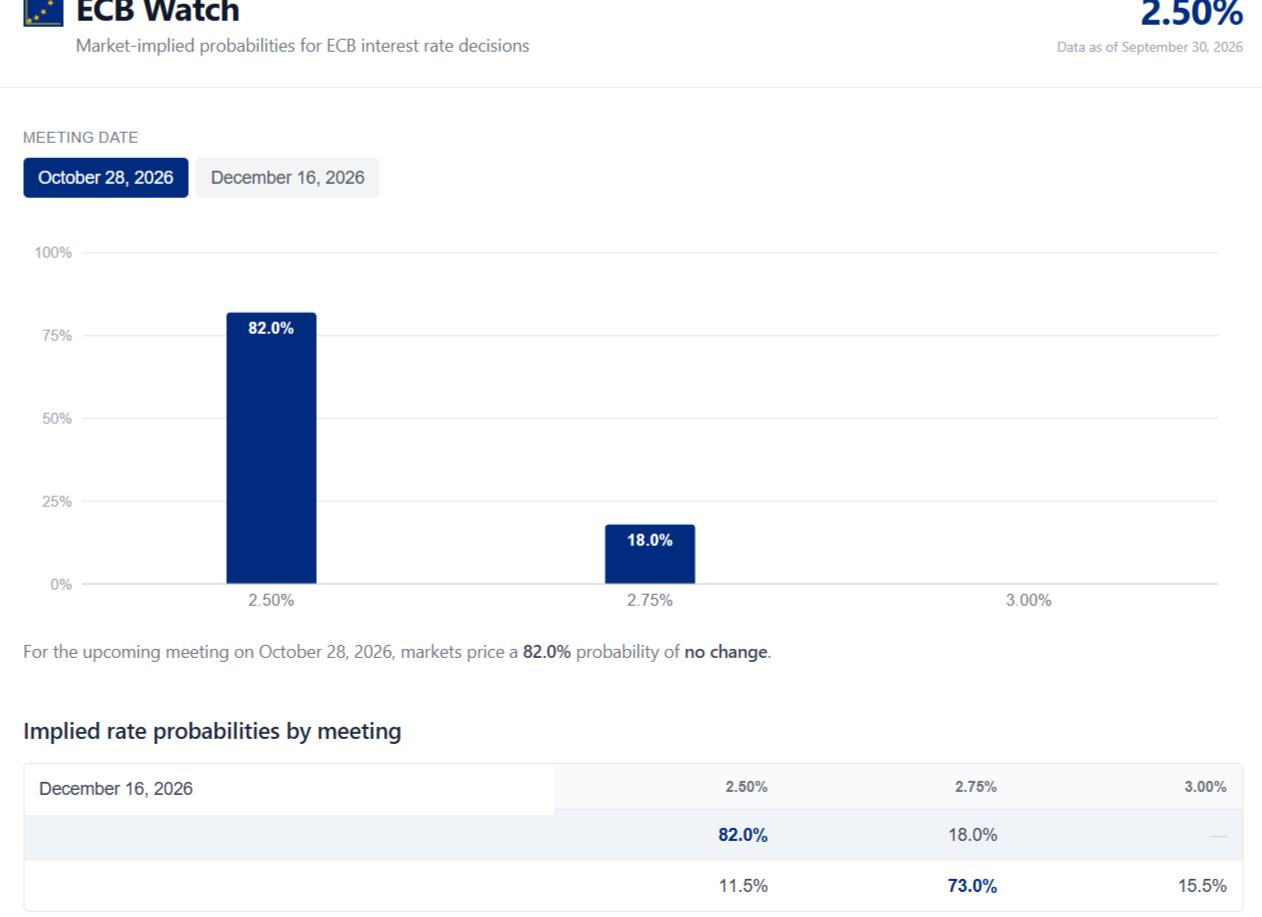
An October hike seems unlikely, despite inflation rising quicker than anticipated across the Eurozone in September, with worrisome increases in energy and food-related inflation. The Harmonized Index of Consumer Prices (HICP) jumped to 3.4% YoY in France, reached 4.1% in Italy and 5% in Spain. German HICP also accelerated, up to 3.3% from 2.9% in August. To no surprise, the Eurozone HICP hit 3.8% YoY, with the core annual reading at 2.5% in the same period. Such a 3.8% is above the ECB’s expected 3.6% for the quarter. Nevertheless, the odds for an October hike stand barely at 18% according to the ecb-watch.eu tool. Such odds are at 73% in December.
Middle East crisis remains the same
The Middle East war is the main cause of rising global inflation. That’s no news. And since the stalemate between the US and Iran remains unchanged, a resolution is unlikely in the foreseeable future, meaning inflation-related concerns are unlikely to recede.
Additionally, winter is coming in the Northern Hemisphere, which means energy needs will increase, particularly in Europe. That means the ECB is more likely to hike rates more times than the Fed. Yet, at this point, it is worth remembering the ECB deposit facility rate stands at 2.5%, while the Fed’s fed funds rate floats in a 3.75% to 4.0% range. The Fed may be moving less frequently, but it is still better to hold USDs than EURs.
What’s next on the docket
The macroeconomic calendar has some interesting figures these days. Monday will bring the September US ISM Services Purchasing Managers’ Index (PMI), and the final S&P Global Services and Composite PMIs for both economies. The Eurozone will unveil August Retail Sales on Tuesday, while the Federal Open Market Committee (FOMC) meeting minutes will be out on Wednesday. The document will offer little insight into what US policymakers plan for upcoming meetings, but speculative interest is likely to hold its breath ahead of the release and scrutinize it ad nauseam once it’s out.
The ECB will publish the Monetary Policy Meeting Accounts on Thursday, while the US will offer the preliminary estimate of the October Michigan Consumer Expectations Index on Friday.

EUR/USD Technical Outlook:
Despite Friday's bounce, EUR/USD is bearish in the near term, according to the daily chart. The pair remains below the 20-day, 100-day, and 200-day Simple Moving Averages (SMAs) at 1.1462, 1.1513, and 1.1609, respectively, while the shorter one accelerated south below the longer ones, usually seen as a sign of sellers' dominance. The Relative Strength Index (RSI) indicator stands at 26, correcting from extreme oversold readings yet far from confirming downward exhaustion. Finally, the Momentum indicator also corrected higher, but remains in negative territory, limiting any further upward potential at the time being.
In the weekly chart, EUR/USD is firmly bearish, having extended its slump below the 100-week SMA at 1.1360, for the first time below it since March 2025. Meanwhile, the 20-week SMA gains downward momentum at around 1.1507. The same chart shows that the RSI indicator heads firmly south at around 37, while the Momentum indicator slowly eases below its midline, all supporting lower lows ahead.
On the topside, initial resistance is seen at the 100-week SMA at 1.1360, followed by the 20-day SMA at 1.1462, ahead of the 100-day SMA at 1.1513. On the downside, the 200-week SMA at 1.1096 provides critical structural support and a potential bearish target. A break below it would open the way for a deeper bearish extension, initially aiming for the 1.1000 psychological threshold.
(The technical analysis of this story was written with the help of an AI tool. Know more.)
Author

Valeria Bednarik
FXStreet
Valeria Bednarik was born and lives in Buenos Aires, Argentina. Her passion for math and numbers pushed her into studying economics in her younger years.

















