The unemployment triggered Sahm Rule: Is a recession on the horizon?

Last week, US nonfarm payrolls increased by 206,000 in June, and the unemployment rate rose to 4.1% from 4.0% in May. The latest FOMC meeting minutes noted the slowing economy and diminishing price pressures, reigniting market hopes for a Fed rate cut.
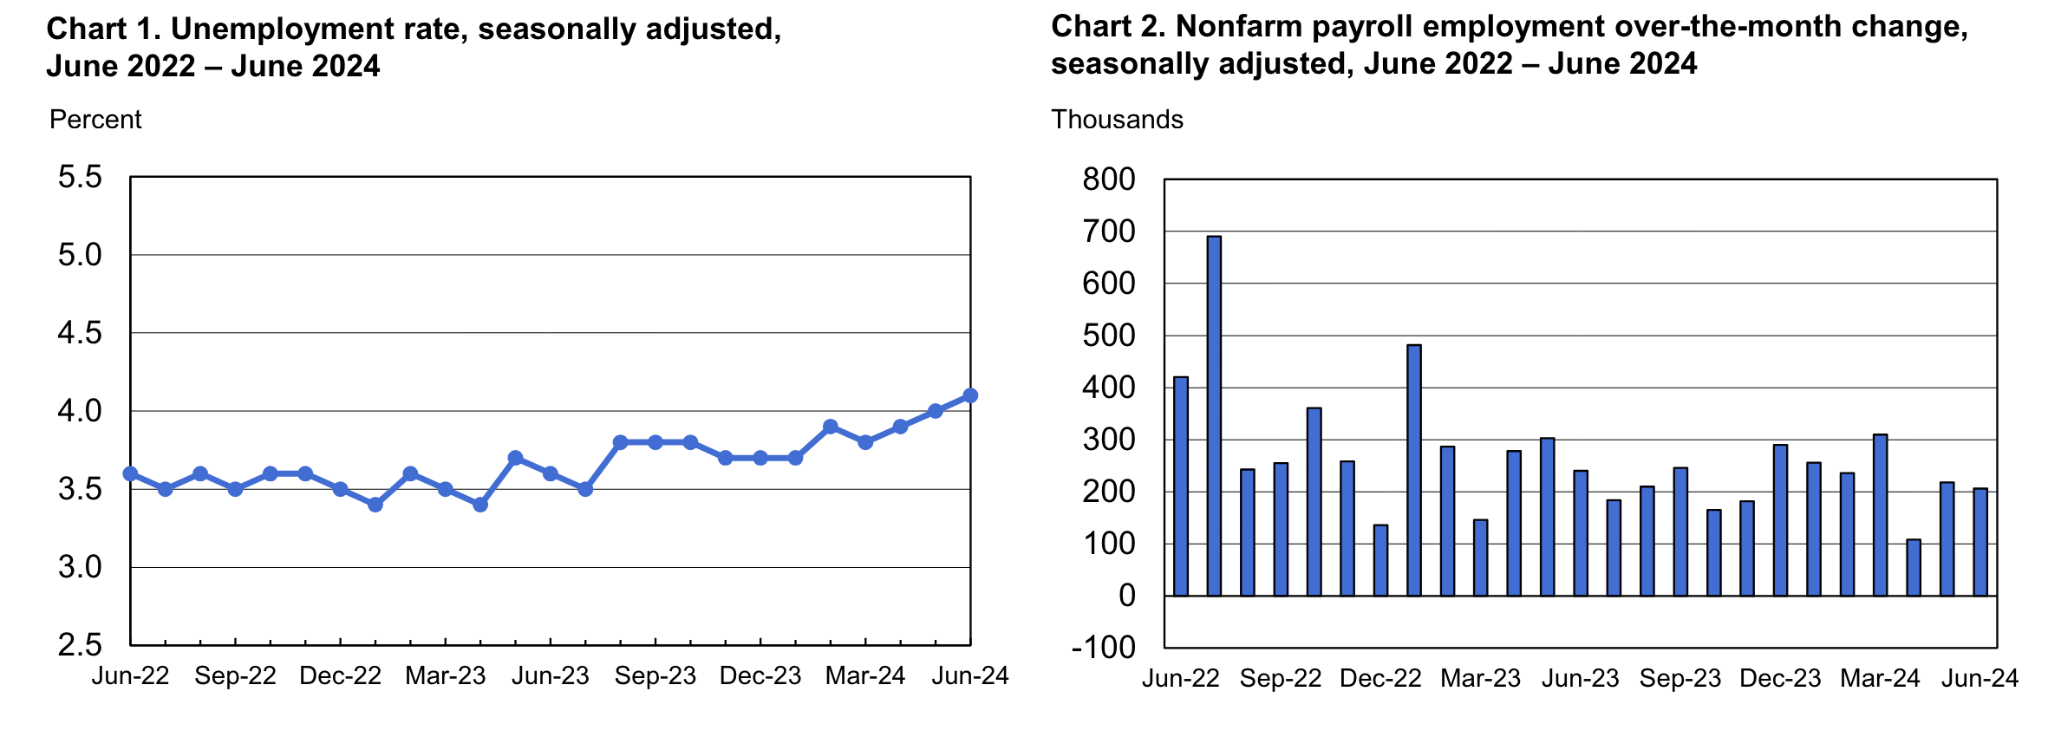
Source: The Bureau of Labor Statistics
The unemployment rate rose to 4.1%, triggering the Sahm Rule. Developed by economist Claudia Sahm, this rule identifies the start of a recession when the three-month moving average of the national unemployment rate rises by 0.50 percentage points or more from its low in the previous 12 months. With June 2024's U-3 rate at 4.1%, the three-month average at 4.0%, and the lowest rate in the past year at 3.5% in July 2023, this criterion has been met.
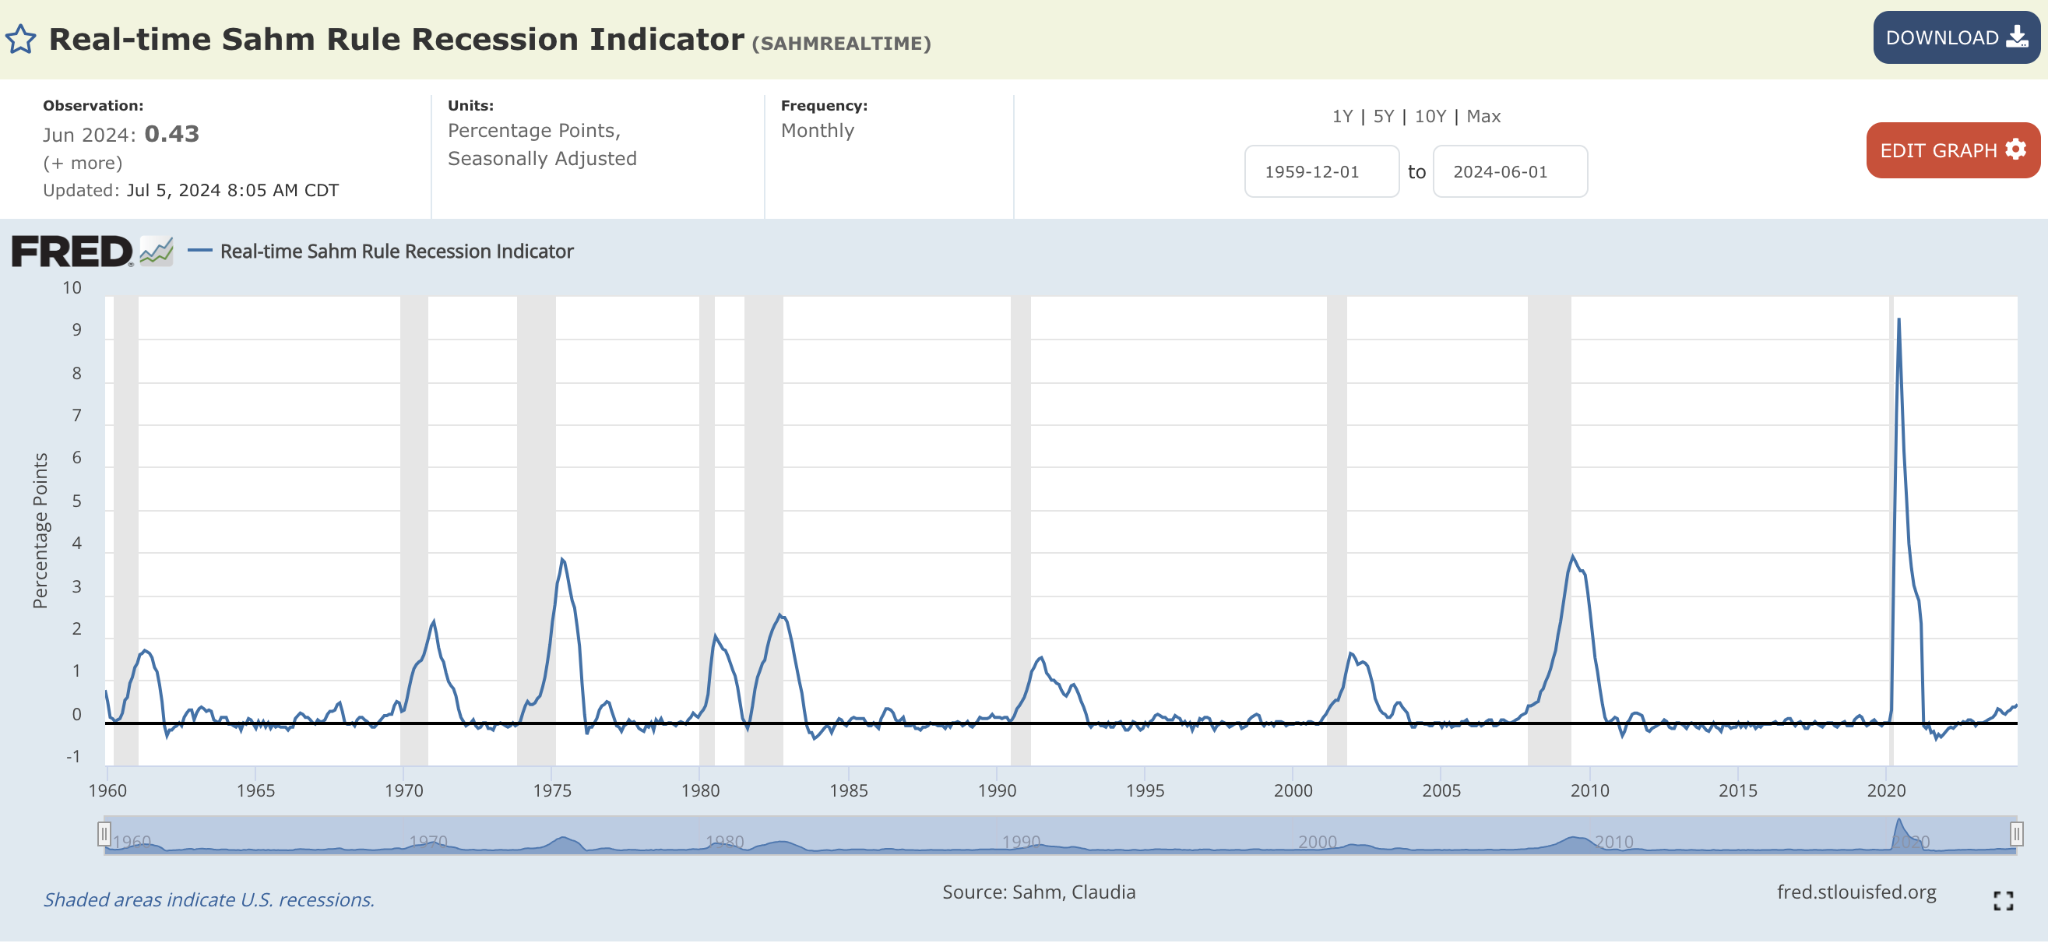
Source: FRED
In the last FOMC meeting minutes, Federal Reserve officials noted that the U.S. economy was slowing and "price pressures were diminishing."
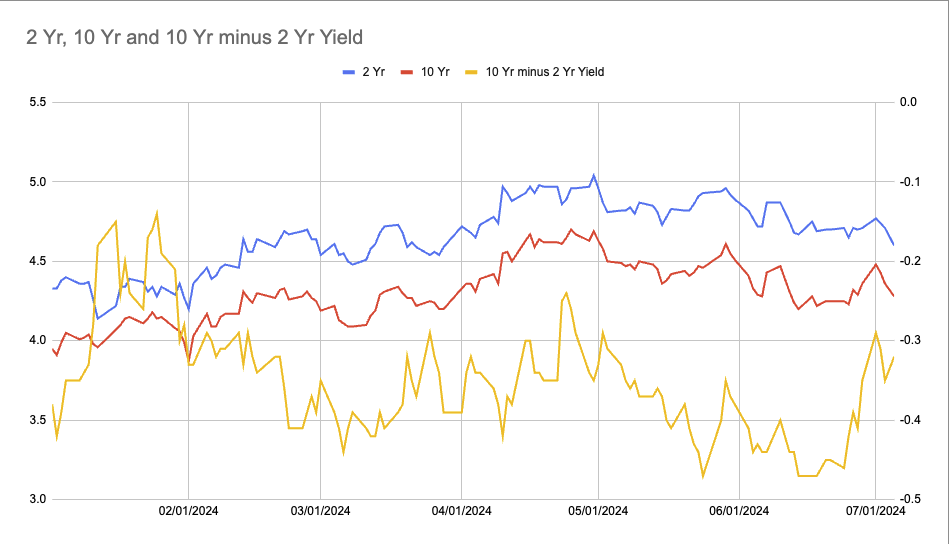
Source: US Department of Treasury
A key warning for the US economy is the inverted yield curve. When the 10-year Treasury yield minus the 2-year Treasury yield turns positive again, a recession is likely. Despite the yield curve turning negative since June 2022, no recession has occurred yet. This is partly due to the Fed's quantitative easing (QE), which involved buying long-term Treasury bonds and pushing down the long-term yield. Currently, the Fed is engaged in quantitative tightening (QT) which will buoyant the long term yield and has elevated short-term interest rates, artificially creating the inverted yield curve. This explains why the yield curve has remained inverted for so long without a recession.
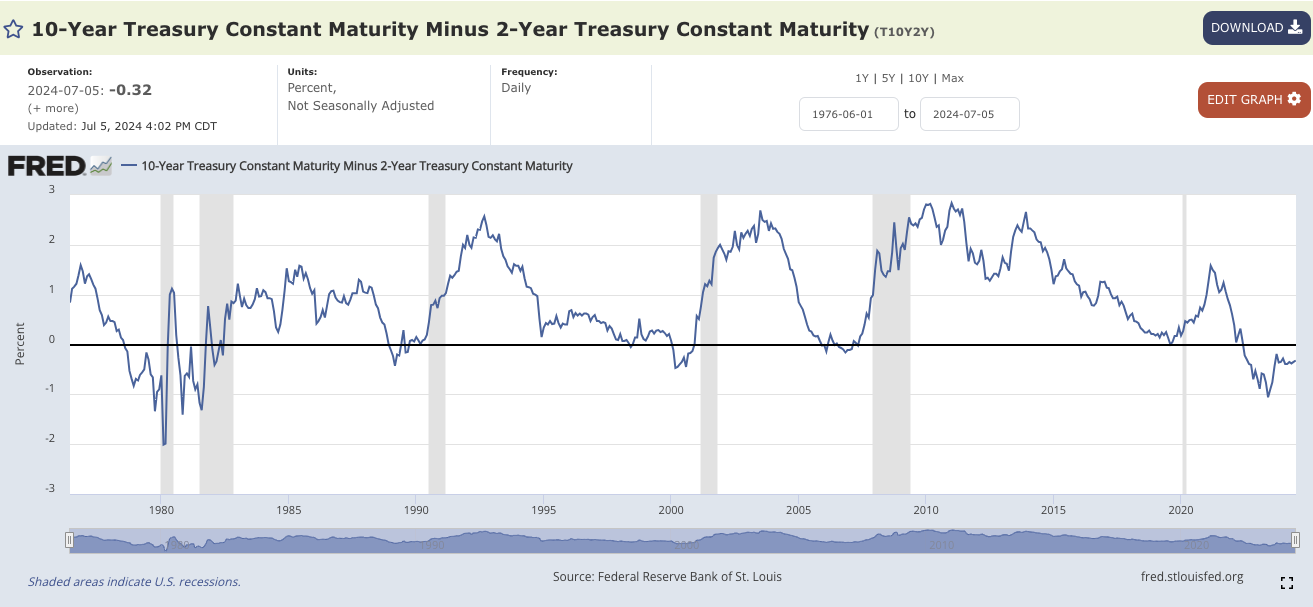
Source: FRED
The market is focused on when the Fed will start rate cuts, despite two recession warning signs. The PCE for May dropped to 2.6%, and June unemployment is at 4.1%. The S&P 500, Nasdaq, Gold, and Silver all rose last Friday after the employment report. According to the June dot plot chart, seven Fed officials expect a quarter-point rate cut in 2024, while eight expect two cuts. The probability of a rate cut in September is now 69%, based on Fed Fund rate futures.
The S&P 500 is nearing new highs, but only 43.73% of stocks are above their 50-day moving average, down from 83.3% on March 28th. This indicates the rally is mainly driven by large-cap stocks, not a broad market rise. Additionally, last week's US employment report confirmed a slowing economy.
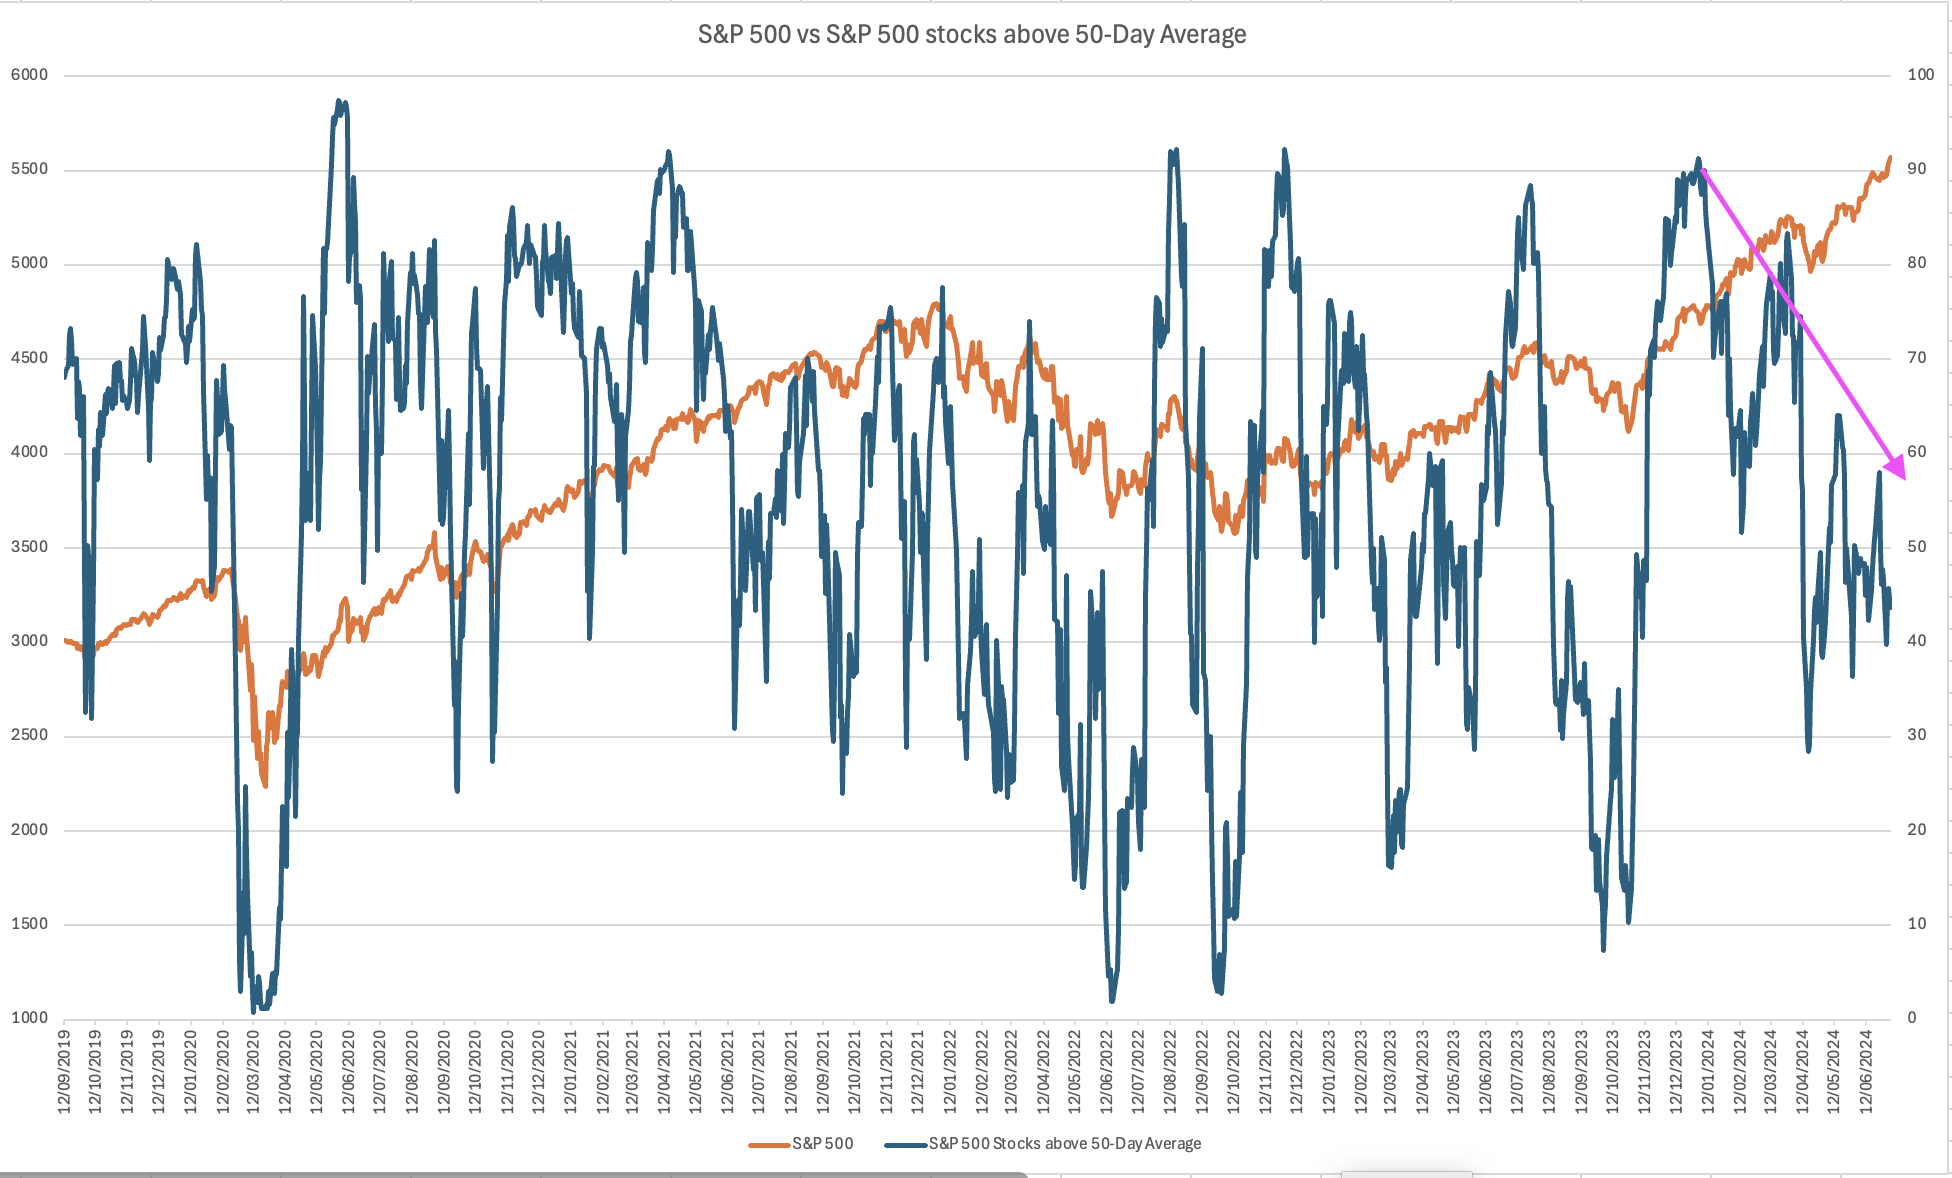
Source: Adopted from Reuters
Technical analysis
The NASDAQ's next resistance level is around 21,200, the upper limit of the regression channel. The stochastic indicator is in the overbought zone, and the market has priced in a rate cut. Despite positive market sentiment, investors should be cautious of a rapid rise.
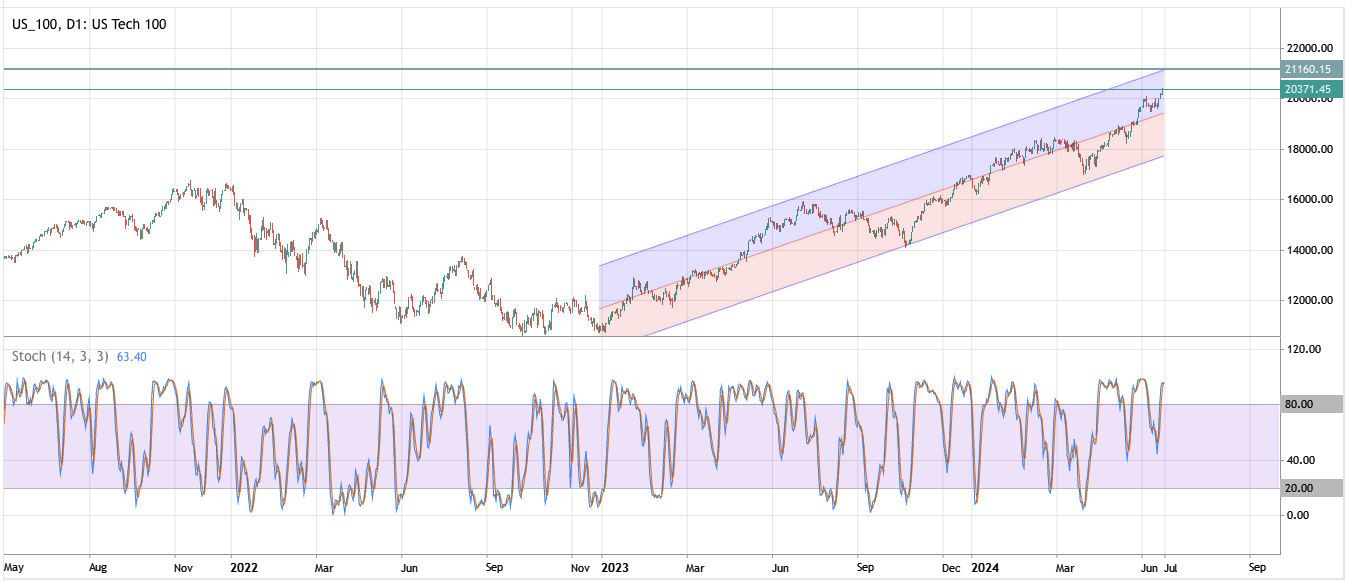
Source: Deriv MT5
Conclusion
Recent economic data shows a slowing US economy with slight increases in unemployment and a cautious outlook from Federal Reserve officials. The S&P 500's rise, driven by a few large-cap stocks, indicates a narrow market rally. Indicators like the Sahm Rule and the inverted yield curve suggest potential recession risks. Despite this, the possibility of Federal Reserve rate cuts keeps market sentiment positive, highlighting the market's reliance on future monetary policy actions.
Author

Prakash Bhudia
Deriv
Prakash Bhudia, HOD – Product & Growth at Deriv, provides strategic leadership across crucial trading functions, including operations, risk management, and main marketing channels.


