The S&P Bubble Is About To Burst
Chaos Clinic for 10/25/2019
In the last two weeks, the S&P has made at least 5 "drives to a top." It is clearly struggling to go higher. Intraday on Tuesday I saw a rounding top pattern that warned of the sharp late drop. Hotline subscribers were shown a "fish" pattern, which turned out to be, as one client put it, a "whopper."
I pointed out that rounded edges in market patterns come from Uranus, because it's axis lies in the ecliptic plane rather than perpendicular. That applies the rotating magnetic component of its electromagnetic field to prices. The result is visible arcs in price patterns. Two of these arcs can form a "fish."
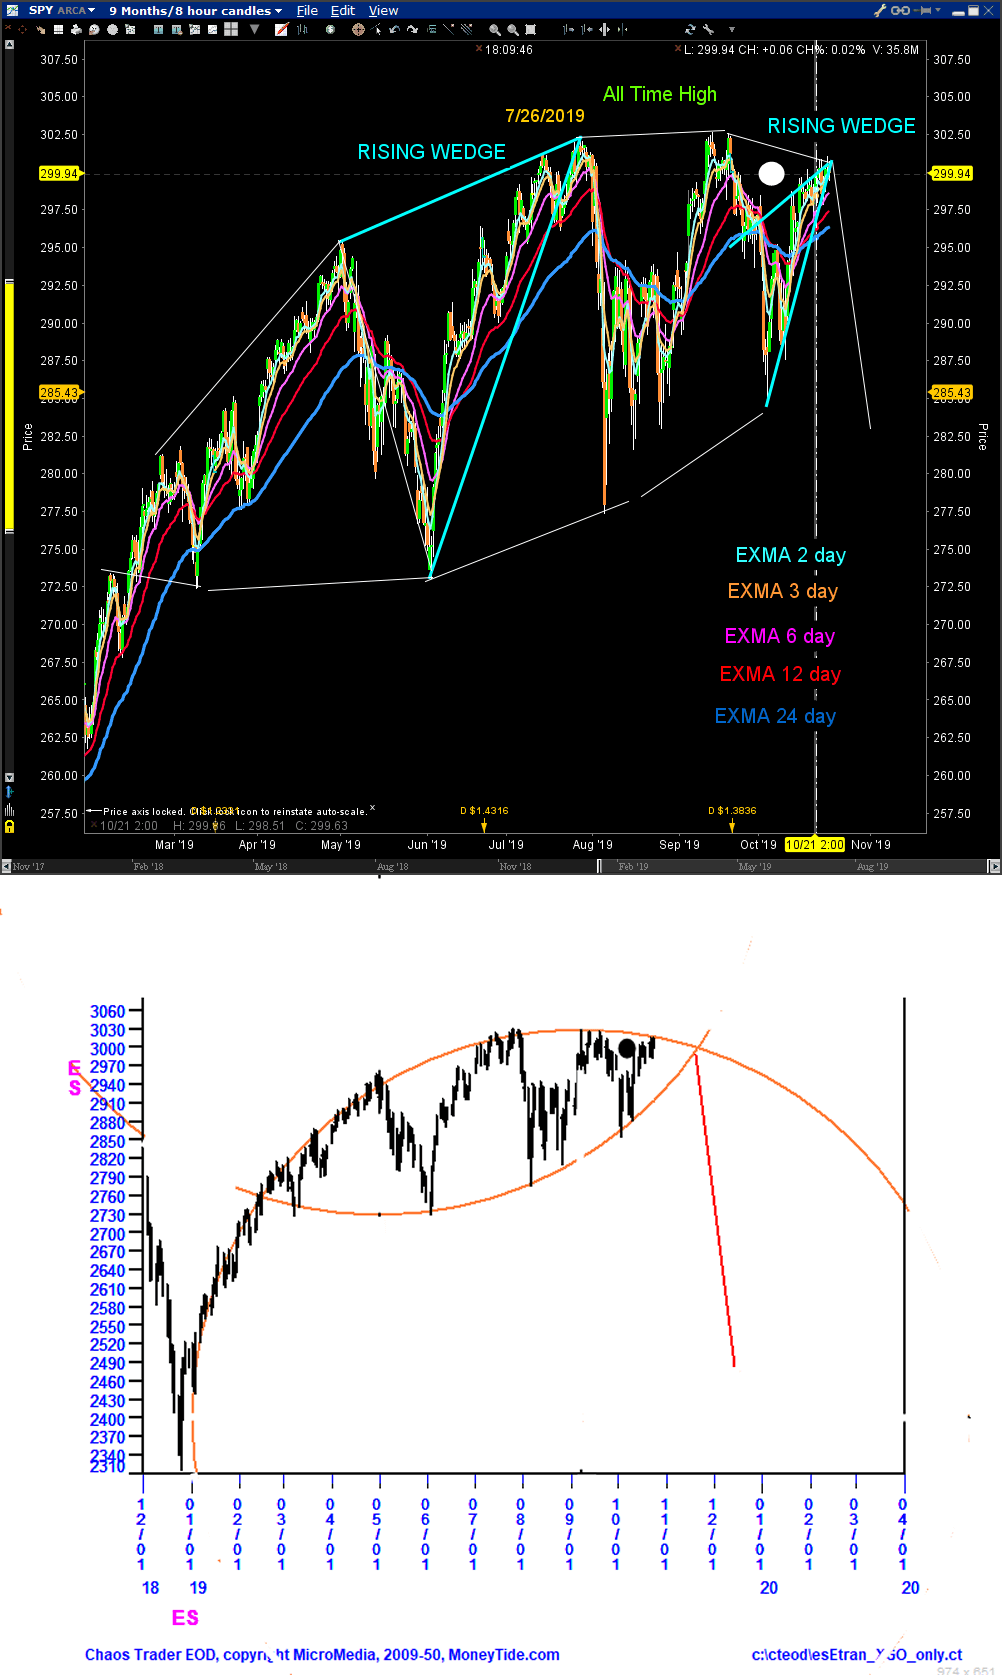
These two charts show how the S&P is struggling to go higher.
The first chart shows SPY over the past 9 months. Until the end of July, it was moving up smoothly. But it was forming a clear Rising Wedge, which broke down sharply. Since then SPY has gyrated wildly. It managed to rally to a marginal new all time high in September. From there it dropped for two weeks, and has now rallied to a slightly lower high, where is is again struggling to go higher. Interestingly, it it has again formed a rising wedge. The top looks to arcing over, and adding an eye shows a possible Larson Fish.
The second chart shows a longer term daily chart of the S&P covering 16 months starting last December. It clearly shows the arc along the top of prices. Another same size arc connecting the recent bottoms shows another possible Larson Fish. The red lines shows a fisherman's line. Fish patterns often break along such lines. Given the current climate with Brexit, impeachment, and earnings concerns, such a break is certainly possible. A break will be confirmed by the rainbow of EXMAs turning down.
Since arcs have something to do with Uranus, I can't help but note two things. First, according to astrologers, Uranus is the ruler of electricity. That this is in the public mind is evidenced by the presence of an unlikely movie, "The Current War." It is about the battle between Edison and Westinghouse aided by Tesla over using direct current or alternating current to power America. Strange topic for a movie. Electricity? It is being released today.
Second. On Monday, Earth conjoins Uranus heliocentrically. The S&P price is currently just over 90 degrees from the price set by this conjunction. Uranus is the planet of big changes. One may be very close. Longer term patterns like this are best traded with Exchange Traded Funds. For the S&P I use SH for short trades and SPY for long trades.
This content was published on Dr. Al Larson's Chaos Clinic which you can attend each Friday for free.
Dr. Al Larson has developed a complete Chaos Model of Markets, four unique courses that let you become a Certified Chaos Trader, some very unique eMylar fractal pattern overlays, and tools that permit forecasting individual stocks and markets years in advance. You can also sign up for a free weekly email, and attend a free Chaos Clinic on Fridays. To learn more, click on the author's profile.
Be sure to sign up for the free weekly email!
Author

Dr. Al Larson, PhD
MoneyTide.com
Dr. Al Larson holds a Ph.D. in Electrical and Computer Engineering from the University of Wisconsin. He is a 1964 Distinguished Graduate of the U. S. Air Force Academy.


