The S&P 500 finally etched a down day

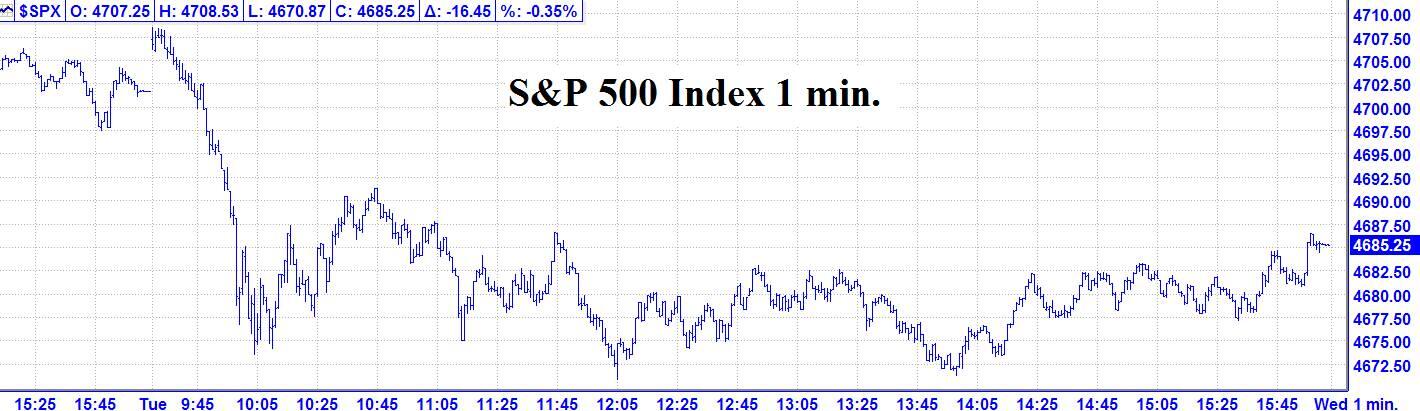
11/09 Recap: - The S&P opened with a 5 handle gap up and then traded another handle higher into a 9:32 AM high of the day.
From that high, the S&P declined sharply 34 handles into a 10:04 AM low. From that low, the S&P rallied 17 handles into a 10:45 AM high. From that high, the S&P zig zagged 20 handles lower into 12:05 PM low of the day. From that low, the S&P rallied 13 handles into a 12:52 PM high. From that high, the S&P declined 12 handles into a 1:58 PM low. From that low, he S&P zig zagged 15 handles higher into the close.
11//09 – The three major indices closed with a moderate down day per the following closes: The DJIA + 112.24; S&P 500 - 16.45; and the Nasdaq Composite + 95.61.
Looking ahead – The S&P finally etched a down day after an 8 day win steak. The low of the day was at 4670.87, which was just above and very close to the 11/04 low at the 4668 area. In evening trading, the S&P E-Mini futures declined another 16 handles, making a low about 11:22 PM, and then rallied sharply to more than recover the losses. At this writing the futures are down about 9 handles. The next change in trend in is due 11/10. After that, the picture gets rather quiet for more than a week. That means that whatever trend is resolved by 11/11, will likely continue for about one week.
The NOW Index is in the NEUTRAL ZONE.
Coming events
(Stocks potentially respond to all events).
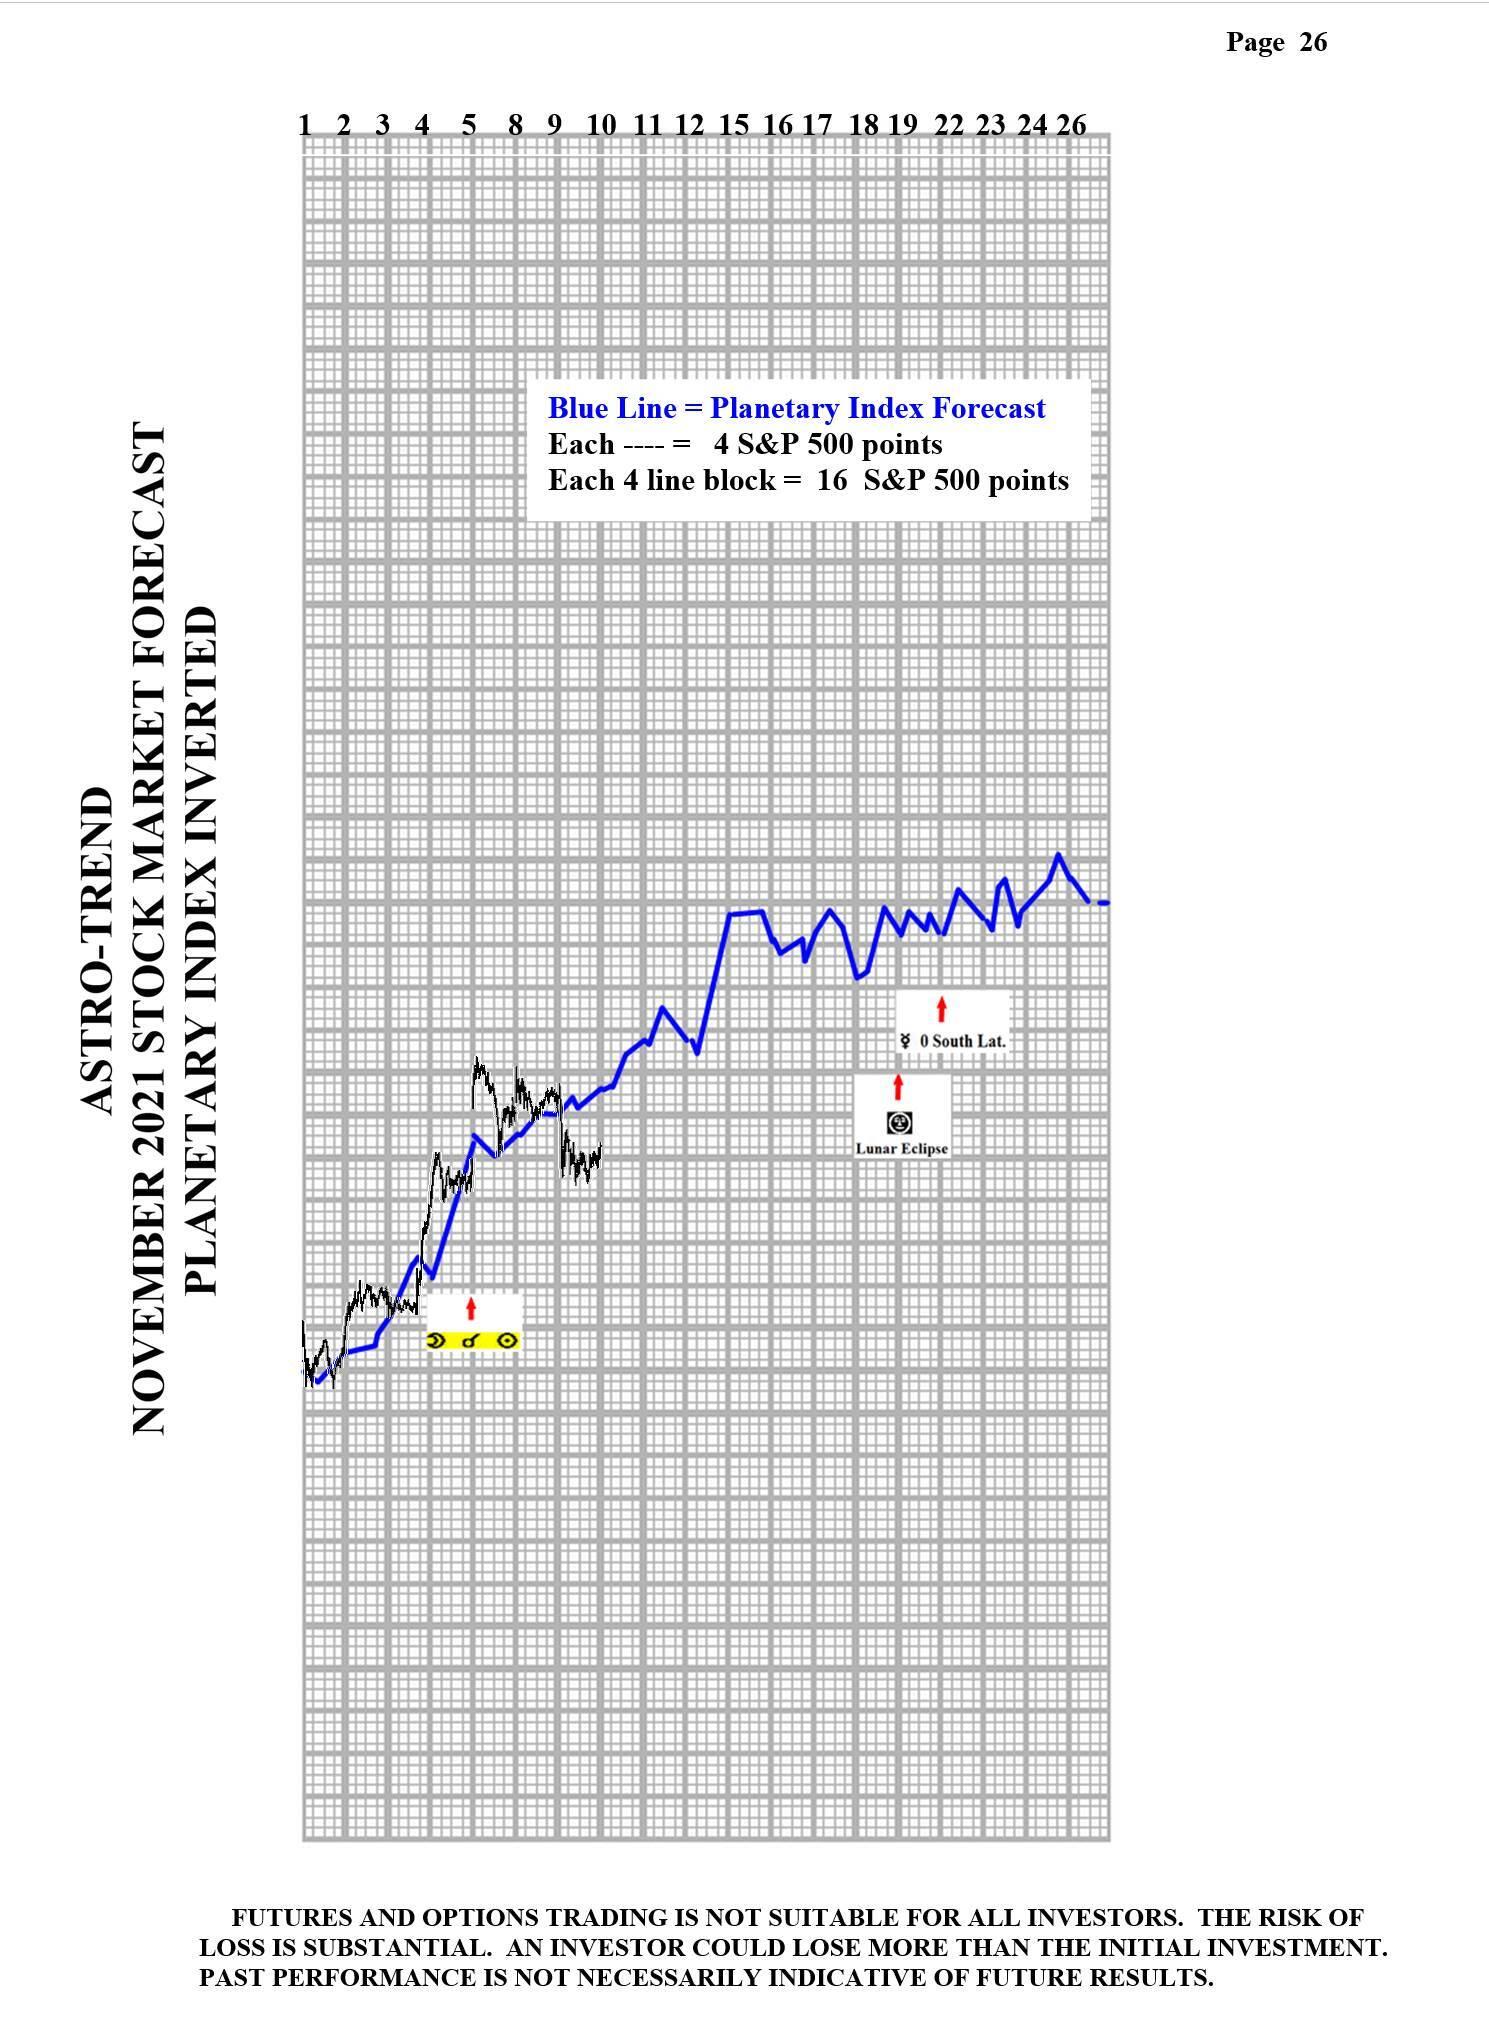
D. 11/09 AC - Saturn 180 US North Node. Major change in trend US Stocks, T-Bonds, US Dollar.
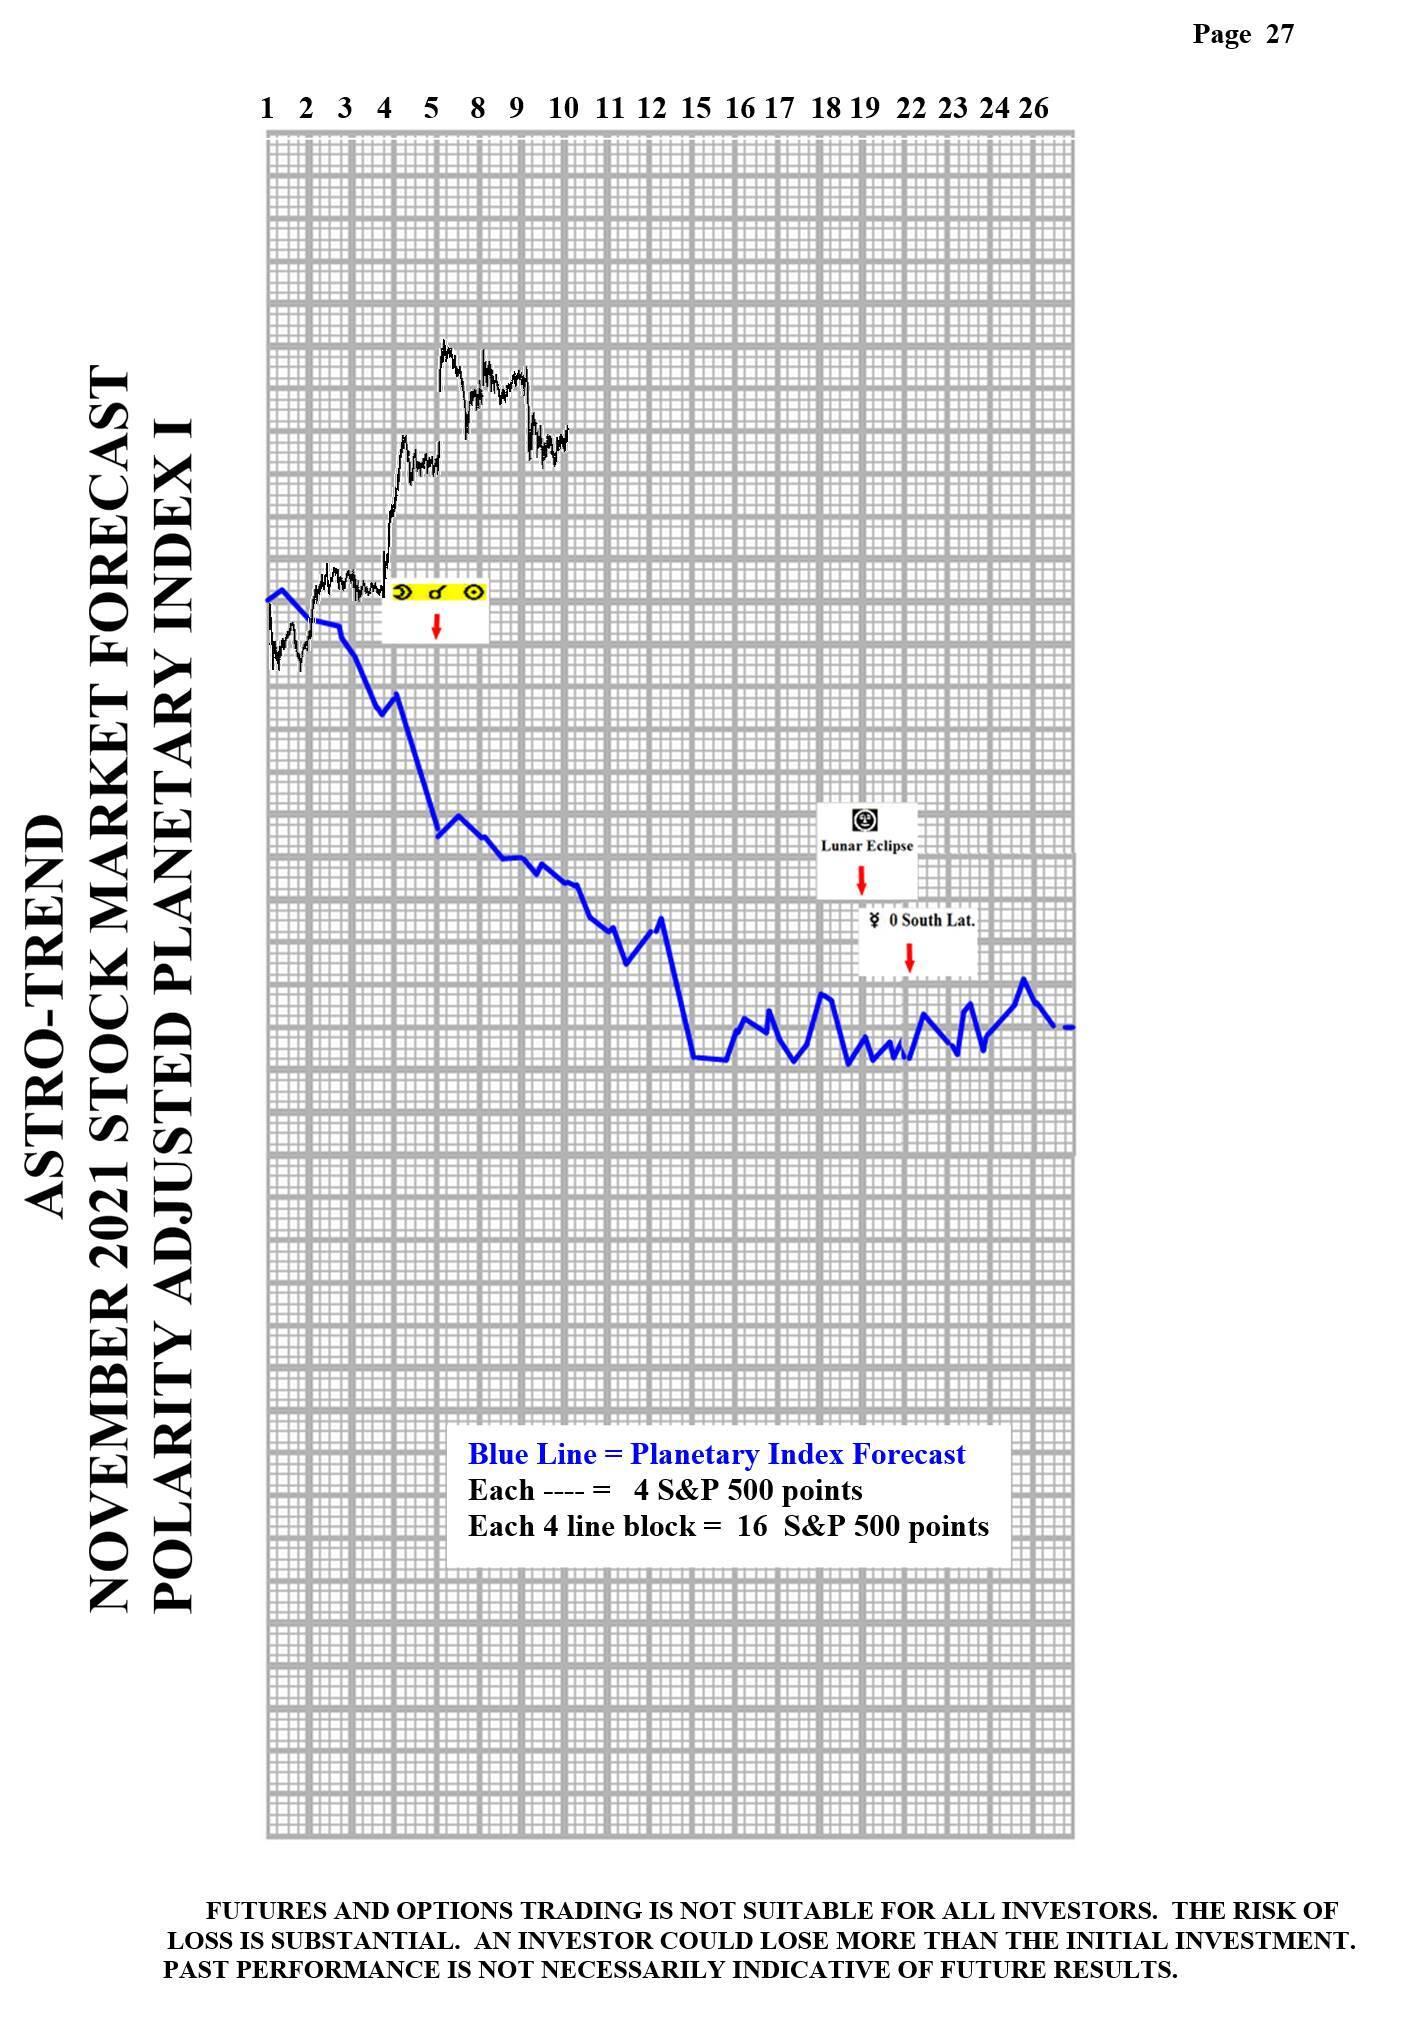
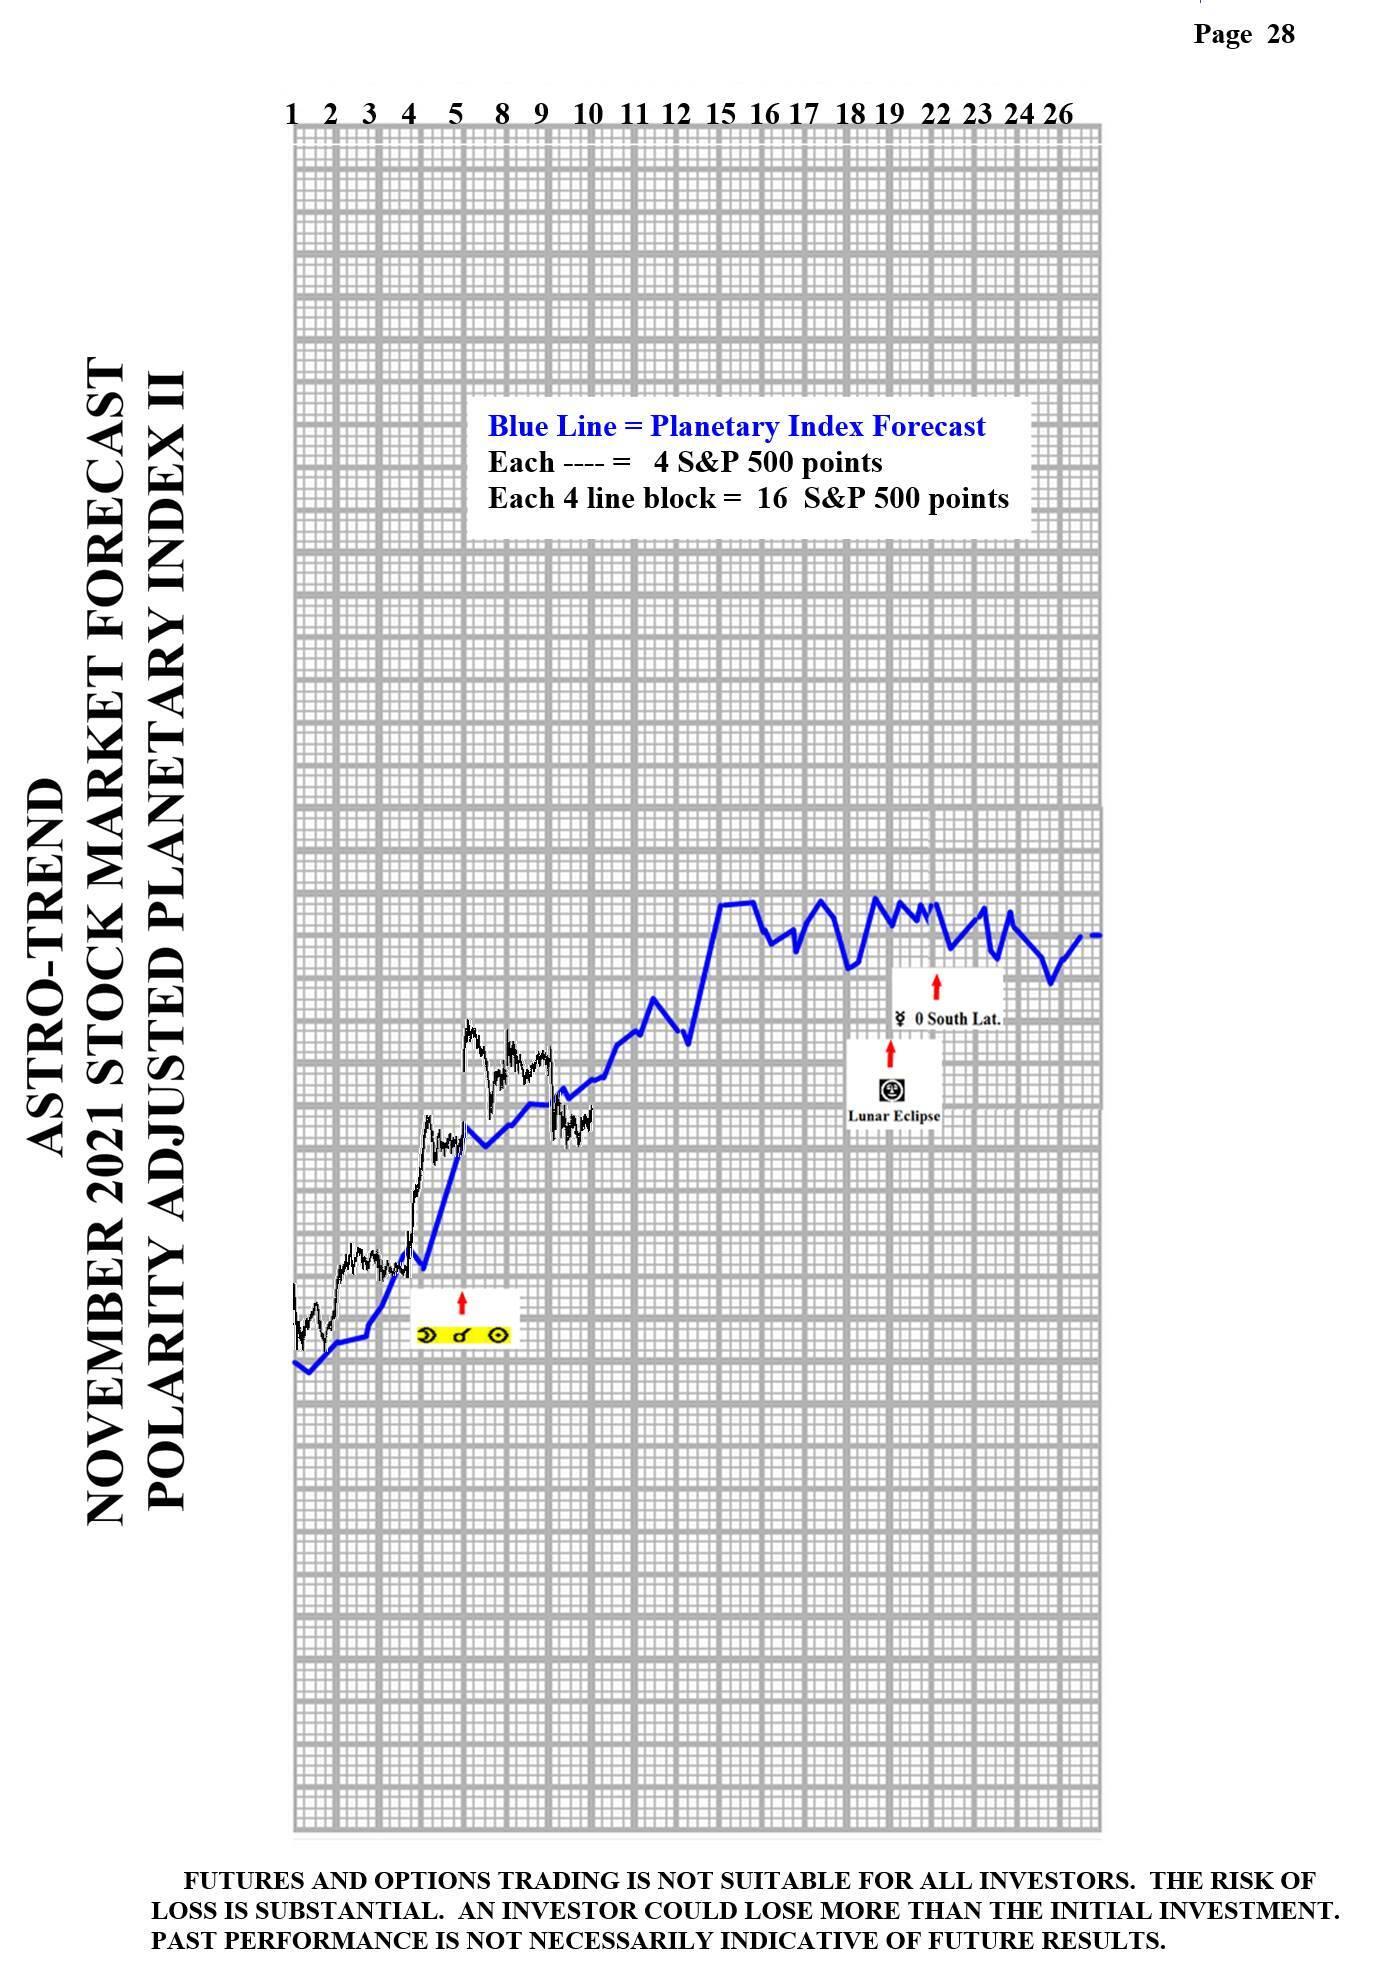
3. A. 11/18 AC – Full Moon/Lunar Eclipse in Taurus. Major Change in Trend Financials, Grains, Precious Metals and especially Cattle and Cotton.
B. 11/19 PM – Uranus 120 US Part of Fortune. Major change in trend US Stocks, T-Bonds, US Dollar.
C. 11/19 AC – Mercury 0 South Latitude. Major change in trend Corn, Oats, Soybeans, Wheat.
Stock market key dates
Market Math
11/29 – 5,161 Music Days from the major 10/11/2007 high.
Fibonacci – 11/10, 11/13, 11/19-22, 11/26.
Astro – 11/10, 11/17, 11/19, 11/22, 11/26.
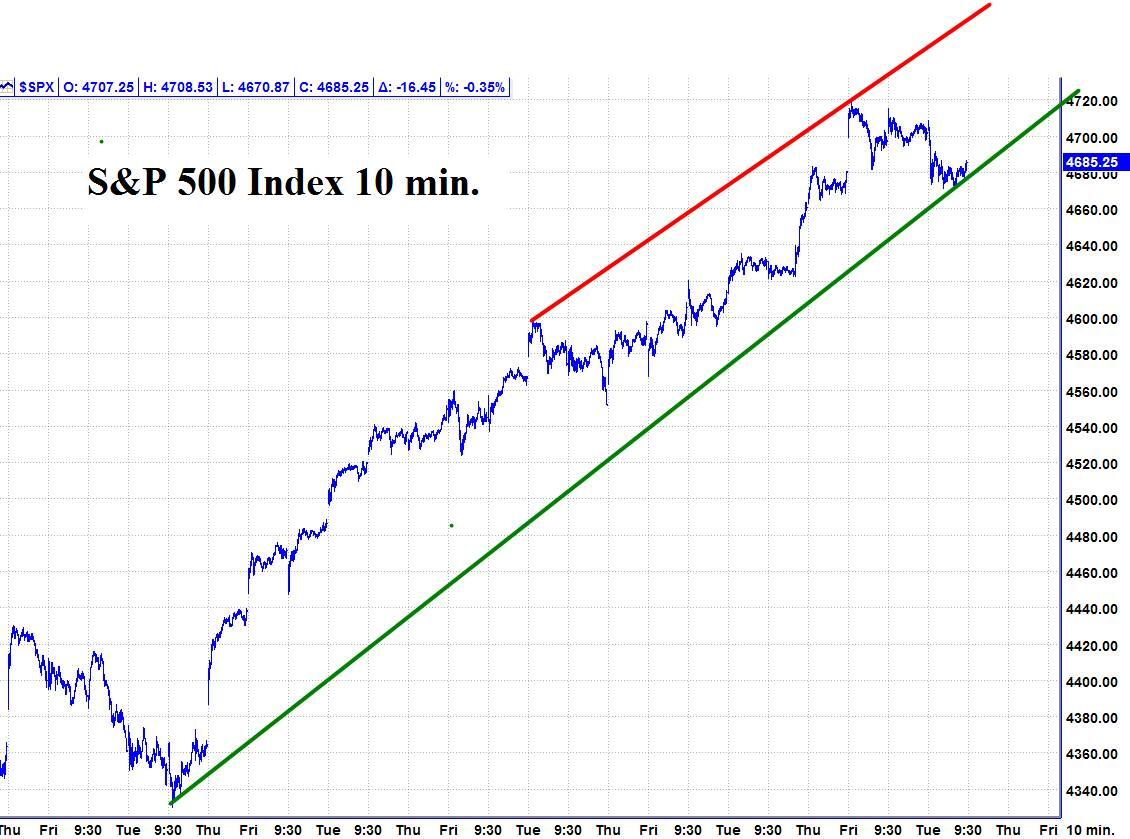
Please see below the S&P 500 10 minute chart.
Support – 4670 Resistance – 4719.
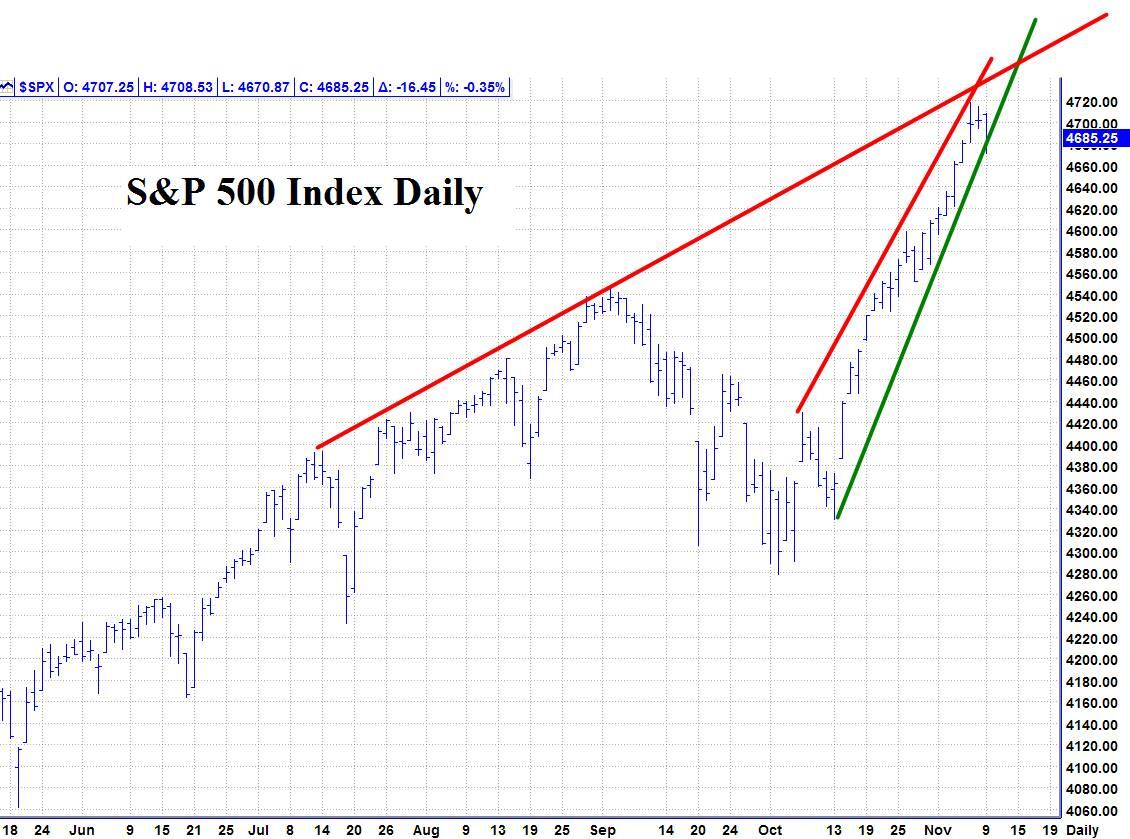
Please see below the S&P 500 Daily chart.
Support – 4670 Resistance – 4719.
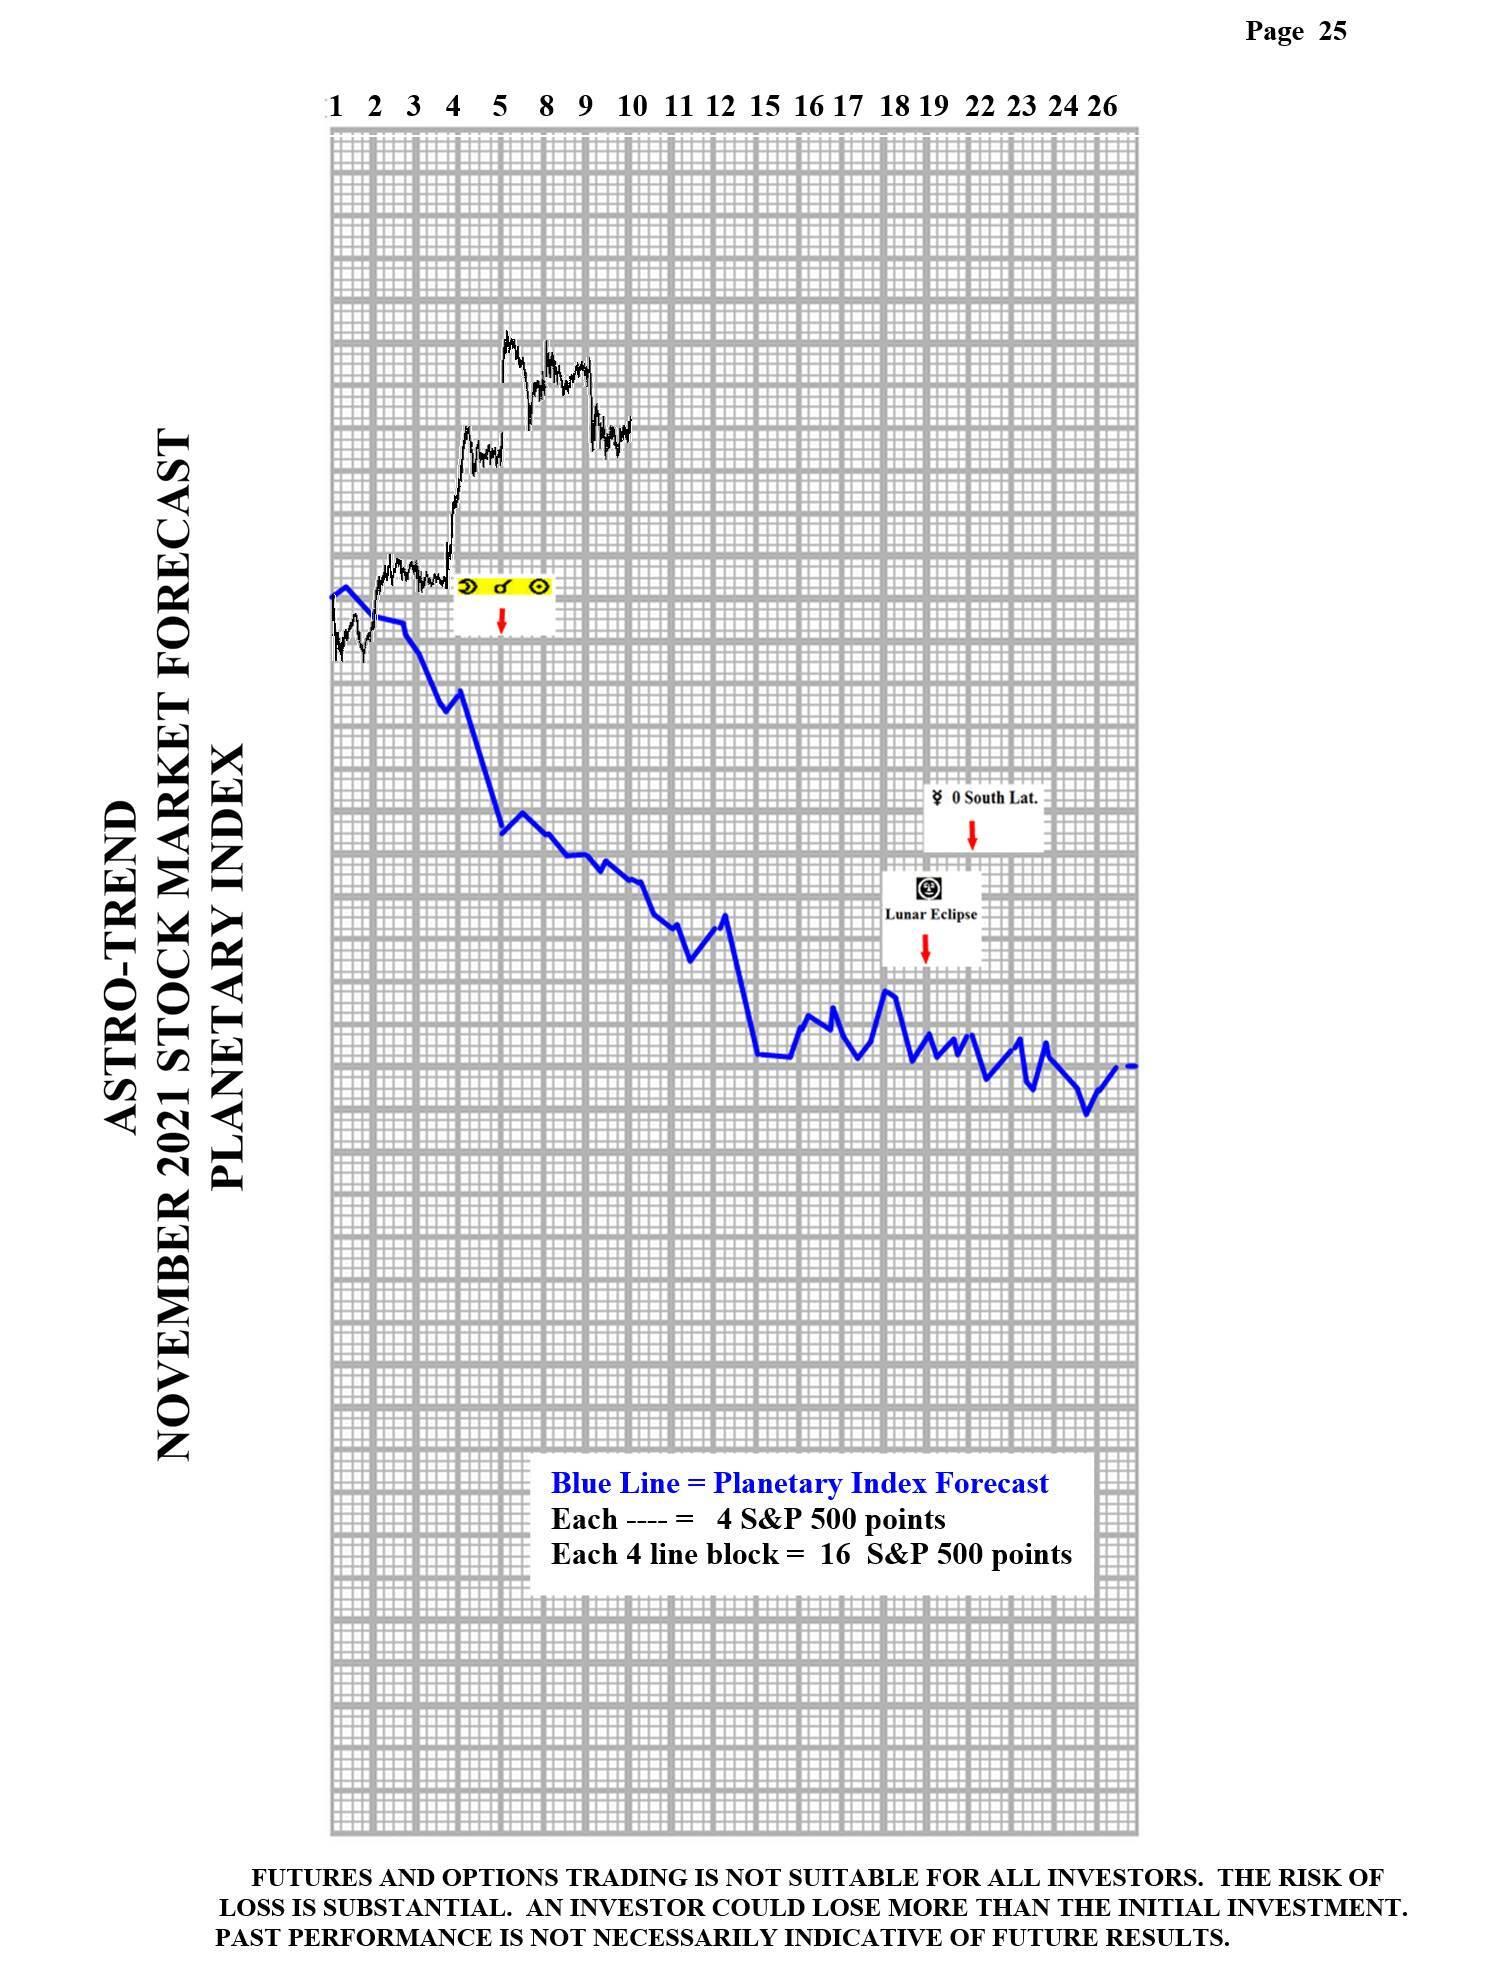
Please see below the Planetary Index charts with S&P 500 5 minute bars for results.
Author

Norm Winski
Independent Analyst
www.astro-trend.com


