The reversal in Gold – The confirmed breakout in USD/JPY
Gold’s huge-volume reversal is definitely THE news that got the spotlight last week. What does it mean?
Gold’s final top?
It most likely means that “this is it”. This was the final top for the price of gold for at least some time. At least that’s what the huge-volume sessions meant previously, especially when gold was similarly overbought as it was recently.
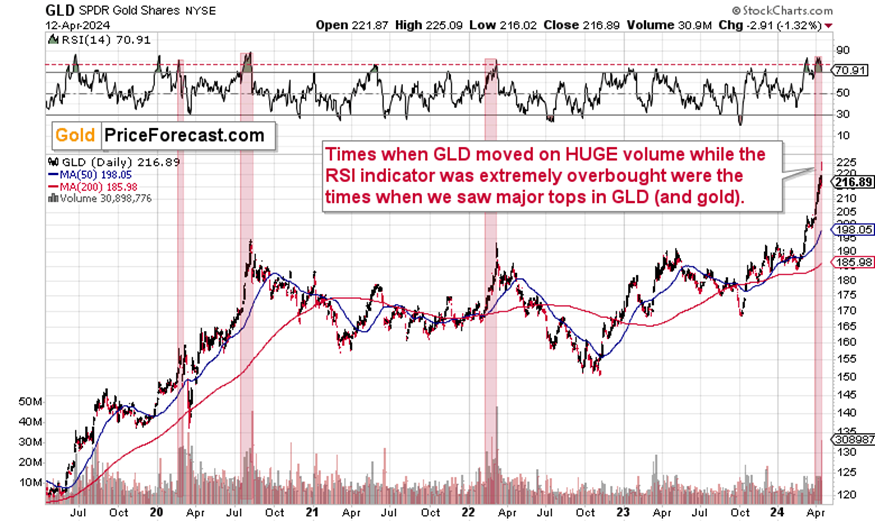
I marked those periods on the above GLD ETF chart with red – when RSI based on the GLD was over 80 AND we saw a huge spike in the levels of volume, it meant that the big rally in gold price was over.
We saw volume spikes in several other cases, and RSI was very overbought in other instances as well, but it is the combination of both that makes that current case – and its three analogies so special.
RSI well above 70 indicates a red-hot sentiment, and the extremely high-volume level proves that it reached its extreme as so much capital / gold exchanged hands.
Besides, gold didn’t “only” (as if it was a small feat, and it isn’t!) move on huge volume while being extremely overbought. It also reversed on that huge volume, which means that the latter confirmed that reversal.
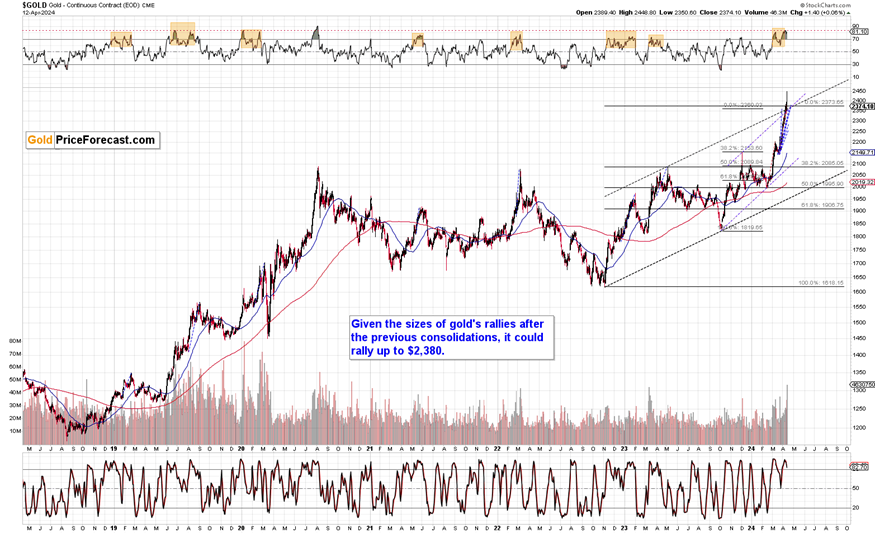
And gold even reversed right above the price levels that were likely to mark the end of the rally based on how far gold rallied previously and based on the Fibonacci extension techniques based on the previous price extremes.
USD/JPY breakout
Gold moved above the target area based on those techniques only briefly, and it reversed shortly thereafter, closing the week back within the area.
I previously wrote that gold would be likely to end its rally when we see a breakout in the USD/YEN, and that breakout was just confirmed.
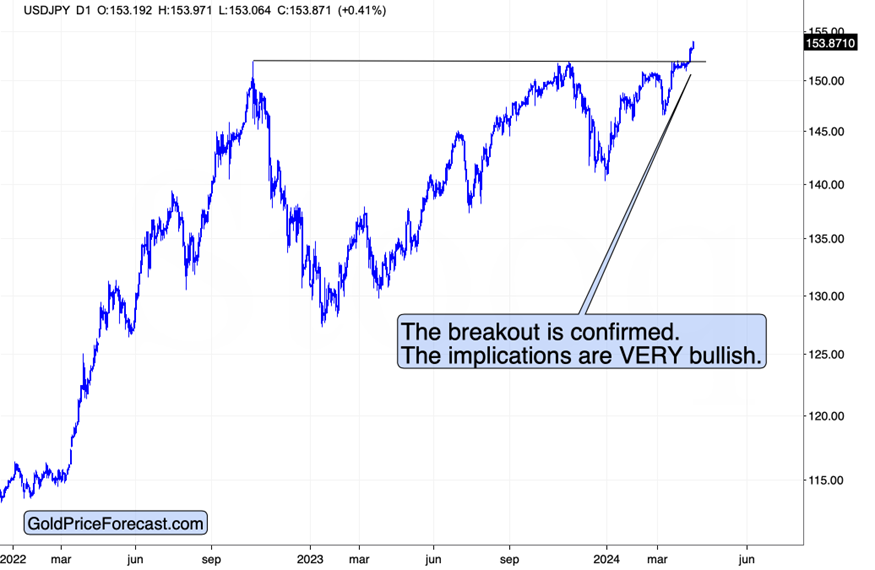
Friday was the third consecutive day when the currency pair closed above its 2022 and 2023 highs, and it was also the weekly close – this makes the breakout confirmed. Indeed, the pair is moving higher also today.
There was a time when the USD/YEN was also after a major breakout, and it was starting a huge rally… And you know what happened to gold, then?
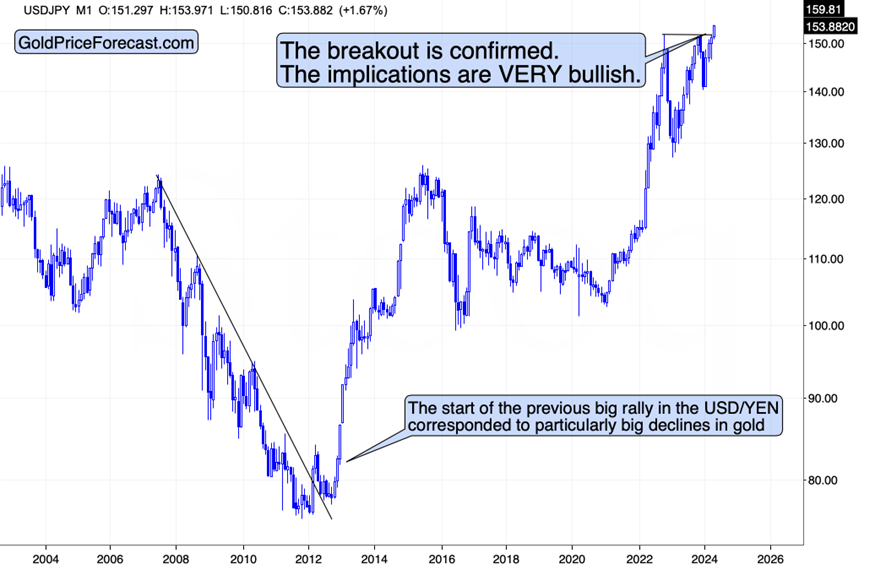
That was in 2021 and it was when gold was starting one of its biggest declines of the past decades.
It might not have to repeat to the letter, but it IS likely to have a big bearish impact on gold prices in the following weeks and months.
Want free follow-ups to the above article and details not available to 99%+ investors? Sign up to our free newsletter today!
Want free follow-ups to the above article and details not available to 99%+ investors? Sign up to our free newsletter today!
Author

Przemyslaw Radomski, CFA
Sunshine Profits
Przemyslaw Radomski, CFA (PR) is a precious metals investor and analyst who takes advantage of the emotionality on the markets, and invites you to do the same. His company, Sunshine Profits, publishes analytical software that any


