The Nikkei 225 in a mood to break records
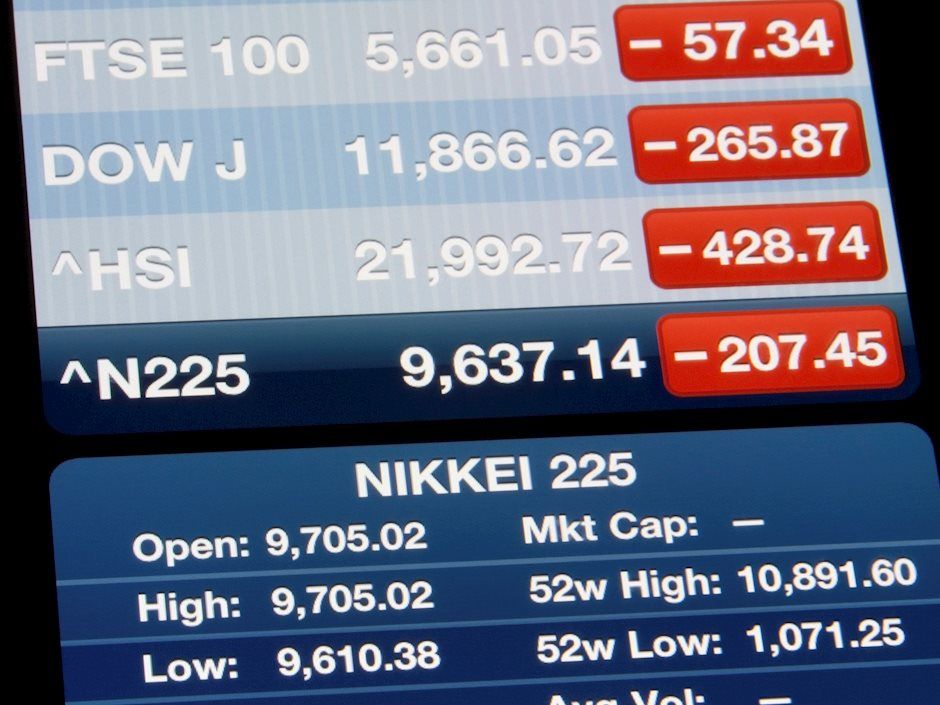
The Japanese stock market continues to flex muscles despite the tumultuous stretch that the Asian economy is currently going through. The Nikkei 225 sank nearly 2 per cent last week after Shinzo Abe announced he would be stepping down from his post as the Prime Minister of Japan, but then the index was able to rebound promptly.
Japanese stocks have also remained largely unfazed by the tribulations in the South China Sea where China and the US continue to play a game of maritime chicken with each other, edging closer towards a dangerous escalation of tensions.
In fact, the bullish run of the Nikkei 225 has been so powerful that the price-weighted index was able to wipe out all of its losses that were incurred since the beginning of the coronavirus crisis. It is currently testing a major resistance level that was last checked right before March's stock market crash.
Today's analysis is focused on Nikkei 225's September Futures contract and its price action. Its purpose is to study the possibility for a breakout above this resistance, as well as to weigh in on the likelihood of a minor bearish correction developing immediately before such an attempt at a breakout takes place.
1. Long-Term Outlook
As can be seen on the daily chart below, several days ago, the price action finally managed to break out above the major resistance level at 23130 decidedly and is currently nearing the historically significant resistance at 23800. The latter is the aforementioned resistance that was last tested prior to the coronavirus crash. Meanwhile, the former served as an upper boundary of a prominent range. Its lower limit is encapsulated by the 23.6 per cent Fibonacci retracement level at 21800.
Understanding the behaviour of the price action around this range is important because it could shed more light on its next direction. As can be seen, it took the Nikkei two failed attempts at forming a breakout followed by two throwbacks before the price action finally managed to establish a decisive breakout.
Consequently, the range's upper boundary is now taking a new role – that of a prominent support. As such, there is a high probability that the price action is going to test it from above. All of this entails high probability that the price action would rebound back towards the 23130 support before it breaks out above the major resistance at 23800.
Several reasons are justifying these assertions. Firstly, the ADX indicator demonstrates the ranging state of the market at present. Moreover, the ADX has been threading below the 25-point benchmark since the 24th of June, and below the 15-point mark since the 17th of August. The Nikkei 225 is ostensibly range-trading, which is not ideal for breakouts/breakdowns of prominent support and resistance levels. In other words, the ranging state of the market is a suitable prerequisite for the development of a new bearish correction, since the price action is nearing a prominent extreme.
Secondly, the price action is currently attempting to form a new swing high above the 23250 level. The latter represents a prominent pivot point, and as such, it also acts as a potential turning point for the underlying direction of the price action. This confirms the primary expectations.
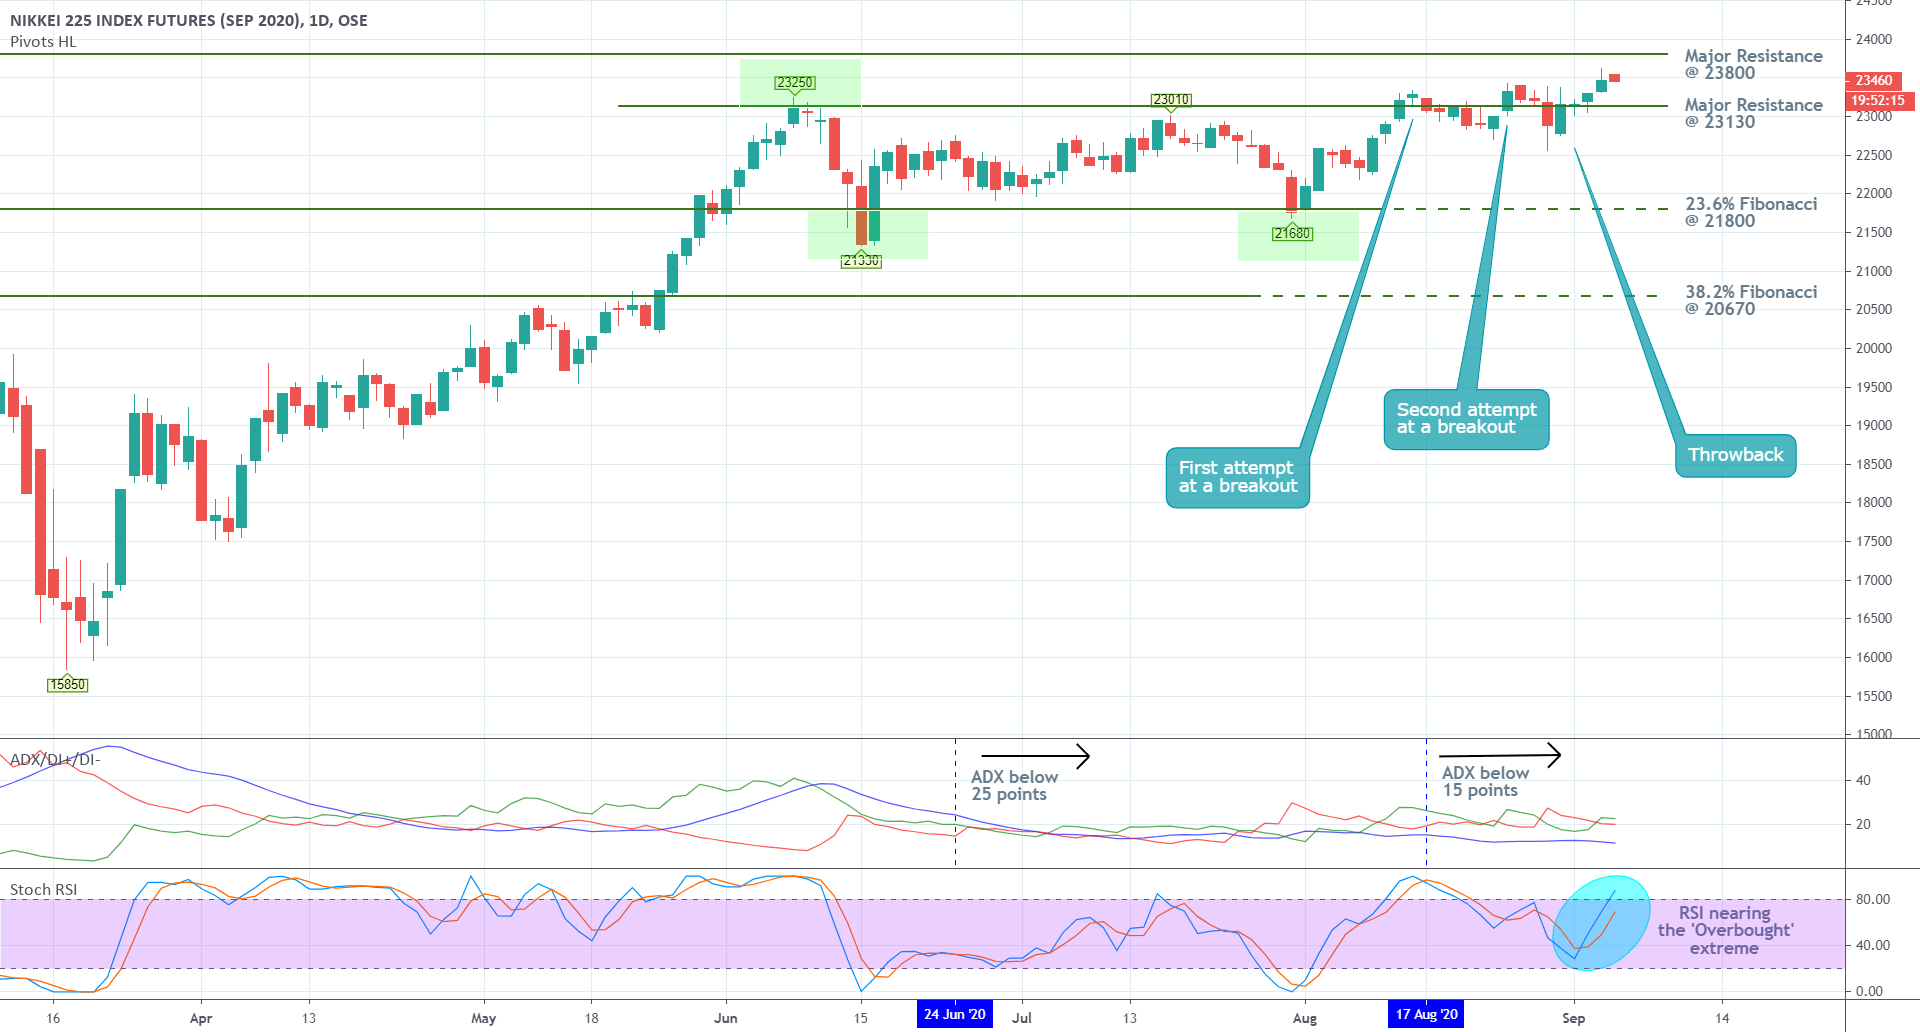
Thirdly, the Stochastic RSI indicator, which illustrates the momentary equilibrium between the underlying buying and selling pressures, is nearing its 'Overbought' extreme. Given the range-trading state of the market, this could prompt the market bears to step up and cause the creation of a new downswing.
2. Short-Term Outlook
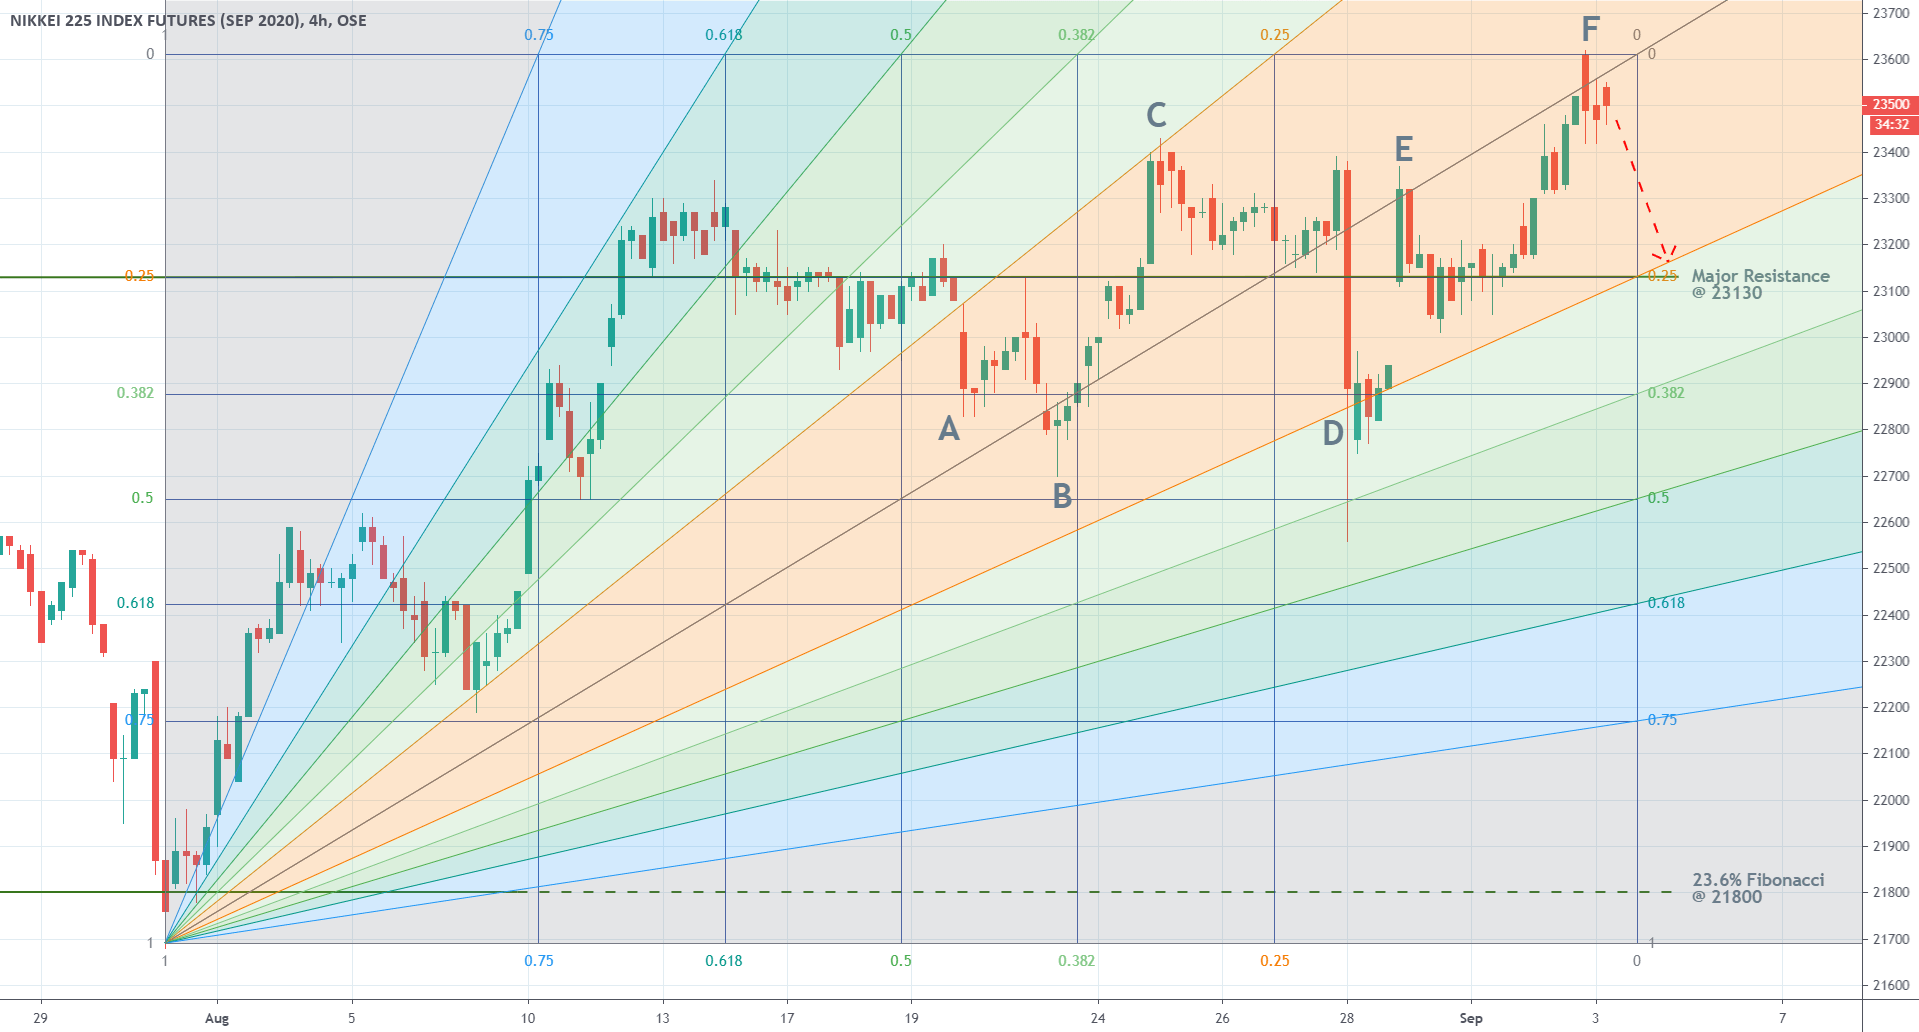
The 4H price chart below utilises the Fibonacci Fan tool to highlight the different stages in the development of the most recent upswing that was initiated from the 23.6 per cent Fibonacci retracement and went on to break out above the range's upper limit eventually. The behaviour of the price action within the middle of the Fan (the areas in red) is of importance here, as it can be used to project the likely direction and scope of any future downswings and upswings.
Point A marks the initial breakdown of the price action within set area. Point B highlights a rebound from the middle line of the Fan, whereas point C demonstrates an opposite rebound from the area's upper edge. Point D shows the sudden dropdown that occurred after Shinzo Abe's statement. Even the shock value of the news was unable to drive the price action lower than that, which represents a significant attestation of the market's strong bullish sentiment.
The price action peaked below the Fan's middle line at point E, before testing and subsequently picking up from the range's upper boundary at 23130. The final point F represents another failed attempt at a breakout above the area's middle line, which gives credence to the expectations for another rebound towards 23130.
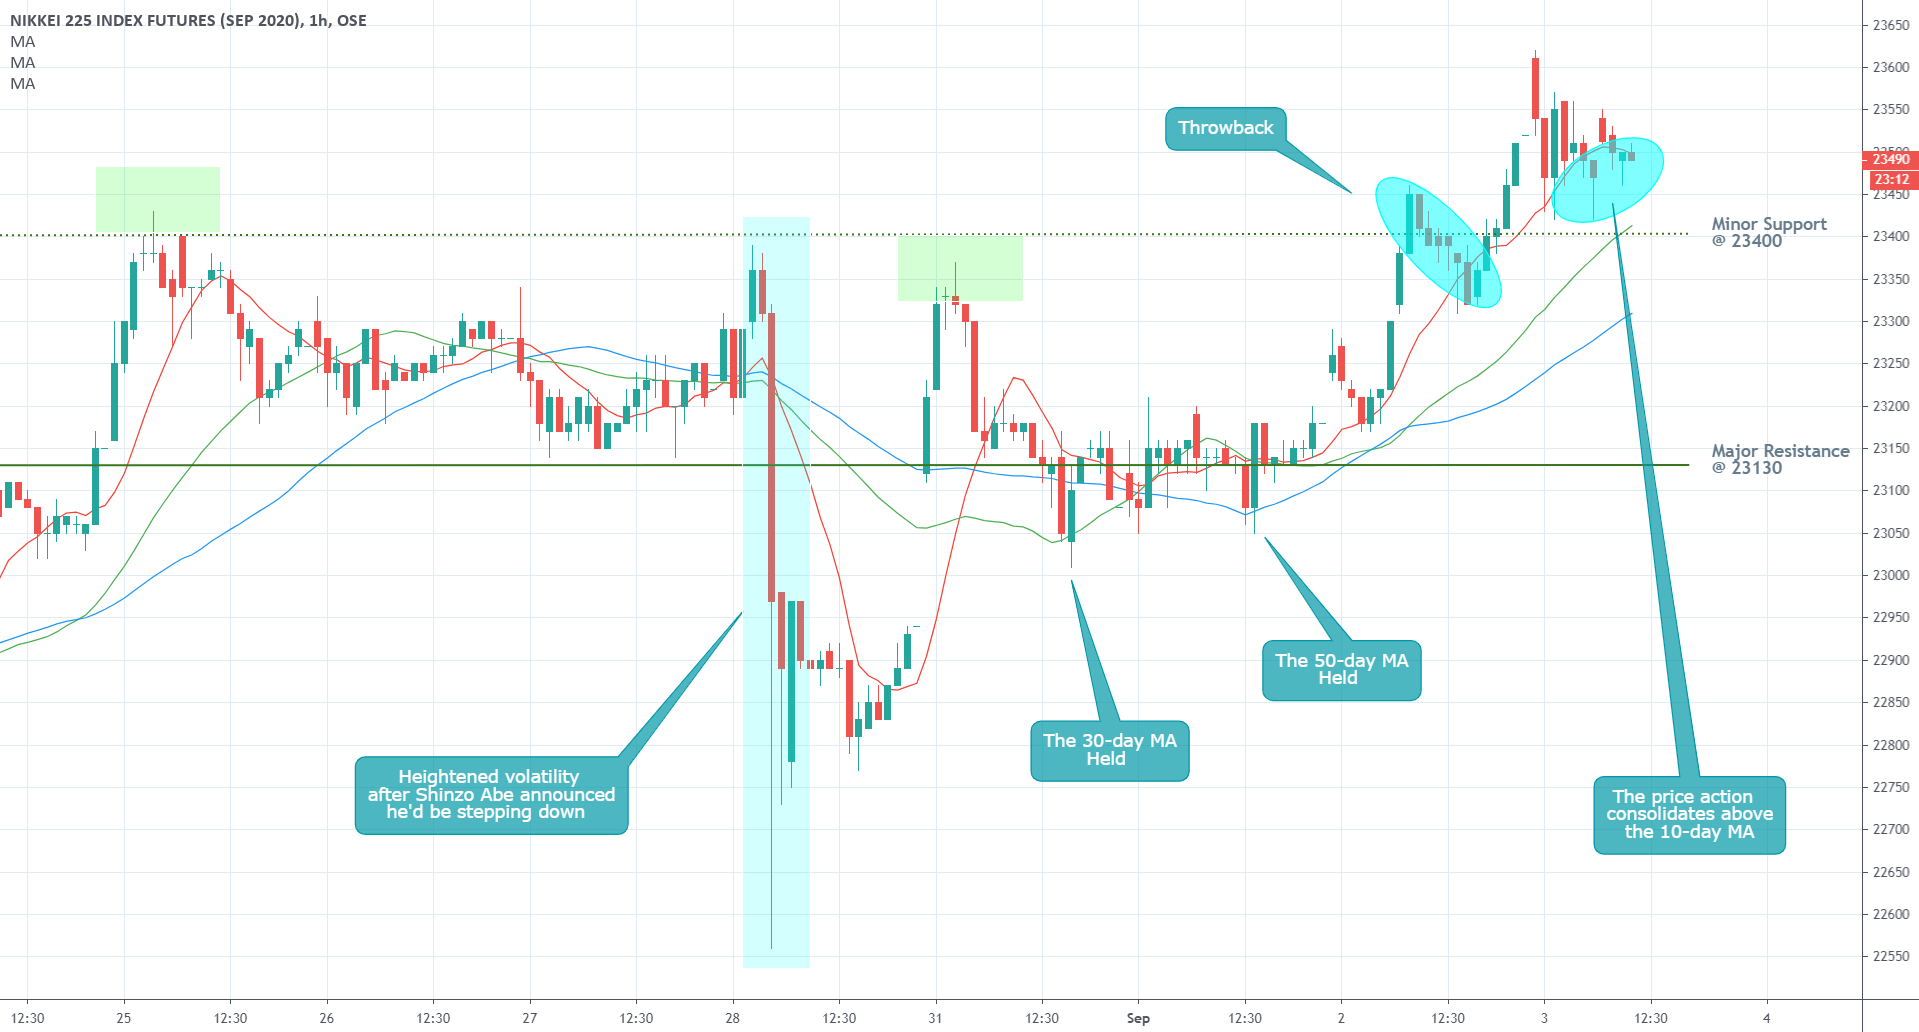
The hourly chart below underpins the market's preparation at developing a new bearish correction. As can be seen, the price action is currently consolidating below the 10-day MA (in red), which is an early signal of the rising bearish bias in the short-term.
Such a downturn would likely head towards the minor support level at 23400. Its significance has already been proven on three separate occasions, as presented on the hourly chart. The importance of this support is further bolstered by the fact that the 30-day MA (in green) is currently converging towards it. A stronger bearish correction could, however, penetrate the two, in which case, the next potential turning point would be the 50-day MA (in blue). It too serves as a floating support.
3. Concluding Remarks
The formation of a minor bearish correction on the Nikkei 225 seems very likely, given the range-trading conditions on the market. Nevertheless, the broader market sentiment remains ostensibly bullish, which means that the bulls are still mostly in control. The index looks bound to test the strength of the major resistance level at 23800 since it was last reached prior to the market crash in early-March.
Author

Plamen Stoyanov
Trendsharks
Plamen started his career on the global capital markets in 2012 when he began trading with financial derivatives.


