The new elliott wave theory in application

In this article dated 9/7/2017, we are going to present Elliott Wave Forecast unique and innovative New Elliott Wave Theory through an example. We covered the Elliott Wave Theory in details in our educational part.
Introduction
As a finance trader, we should not trade the charts but a system. The Elliott Wave Forecast chart is a map that our analysts pull up as the most likable path, considering count, correlation, pivot, distribution etc, mainly. A chart describes what happened in order to project price action into the right part of the chart. Now, we don’t fight the map. If an instrument is bullish in daily then we do not sell that instrument even though the 1 hour chart is bearish. The higher trend will prevail most of the time.
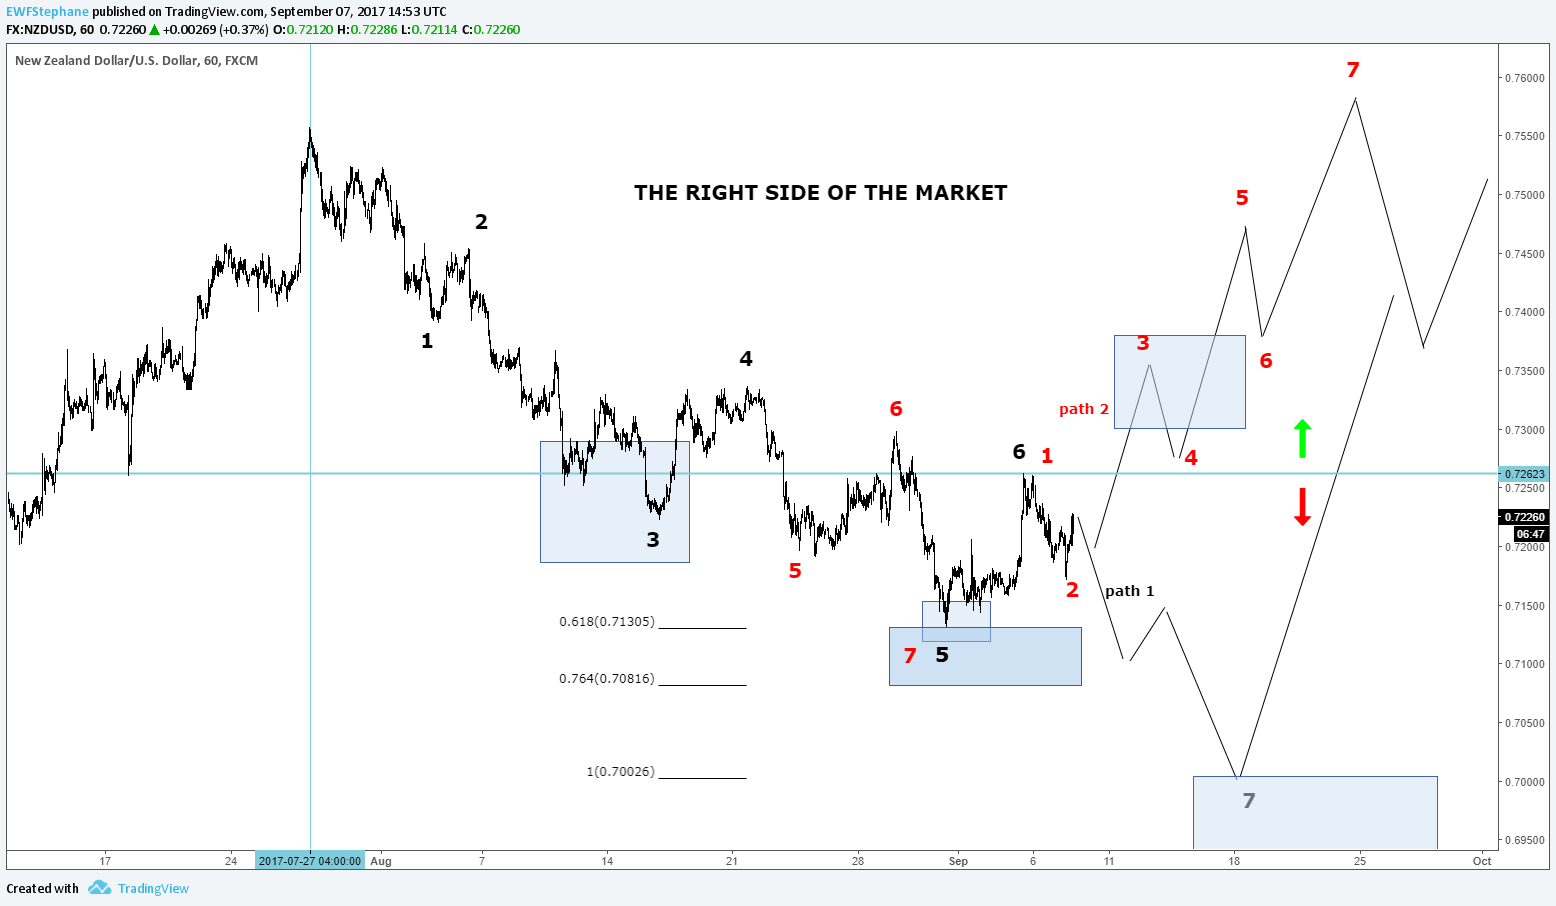
The right side of the market
So, Elliott Wave Forecast developed a system where we buy/sell extension in 3, 7, 11 swings in corrective cycle to the main trend. As we believe that the Forex market moves in cycles of 3 swings, we have established the Blue Box system that you see on all our charts and where the market is likely to react. We call this area the ‘no enemy zone’ where buyers and sellers are in agreement and a reaction is be seen.
Look at the 1H chart of the NZDUSD below since end of July 2017. You may feel compelled to sell the instrument. Many wavers following Elliott Wave Theory would have placed 10 times a 5 waves move in the first leg in black. Since early stage, we have been telling our members not to do so. We surely have told them to buy at black 3, we tell them to buy the black 7. Would have I lost all my capital? No, because I follow our system and do not just trade the charts.
EWF charts contain Elliott Wave labeling because it is now universal, but we found that was not the system that would allow traders to make trade setup, to be profitable, etc. We use another counting system that is compatible with Elliott Wave Theory and do not violate any of its rules. It allows us to clearly define bullish or bearish sequence and when to stay on the sideline.
Why is it not a sell?
Because the NZDUSD is bullish in daily. We look at the daily chart and do not need any indicator or other tools to see this. However, we do understand correction but to exploit NZD weakness, we would have focused on other instruments like EURNZD for example. So, I will position buy order at the black 7 area with a stop loss that makes senses with the chart, together with a proper risk management.
Now it’s the market to do its thing. We don’t do the market. But we won’t sell, we cannot buy at those level, so we wait. That is the life of a trader, looking for setup and wait for the market to come to us, without forcing.
That being said, if you have looked at all different charts delivered by the analysts from the moment I write this blog and July 2017, the count would have changed many times. Does that bother me? No, because I had nothing to trade in NZDUSD during that period.
When my order is triggered, am I going to be affected if the count changes again? No, because I would have put my stop loss where it belongs according to our system. My risk would be set to 1-2% of my account and if price reaches my target, I will feel lucky and thankful. Period.
In case the trade is not filled and price moves higher, I will not chase it because this is not our system anymore. I will look at the chart again, and repeat the process to find buying opportunities. More importantly, I will be on the right side of the market.
We will meet again if you wish to see what is happening next.
Conclusion
What matters to a trader is not the chart or the count by itself. What matters is all the components that are around the charts. This is what we do at Elliott Wave Forecast. We show you the path and have you stay on the right side of the market. And we do that for 78 different instruments with 5 daily updates and 4 live sessions. Every day. We also propose 2 Live Trading sessions where we explain setups in details.
Author

Elliott Wave Forecast Team
ElliottWave-Forecast.com


