The Nasdaq 100 was the strongest broad market segment
Highlights:
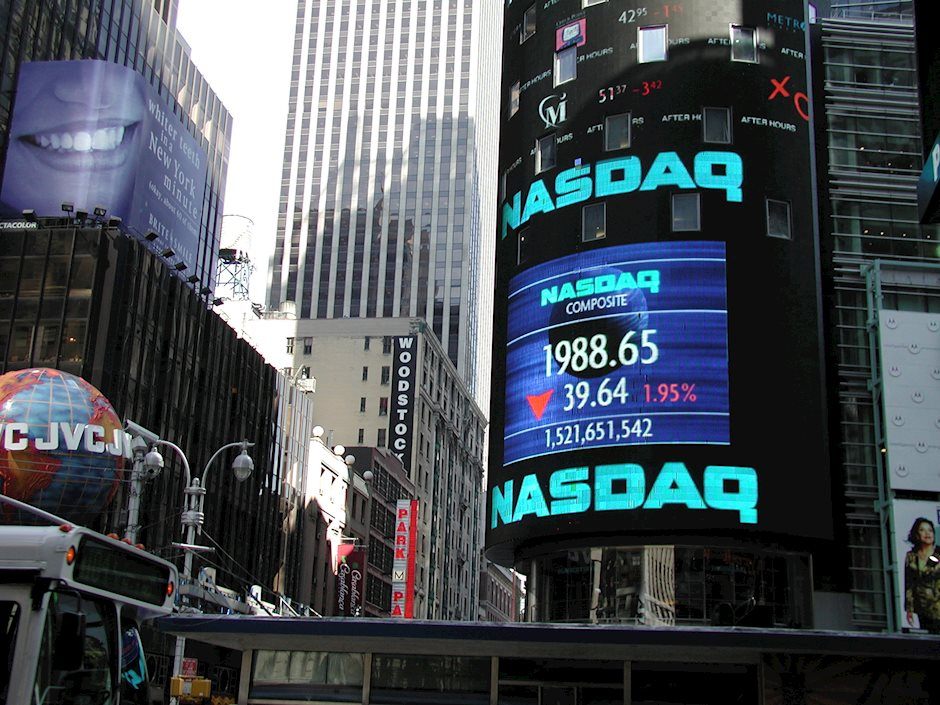
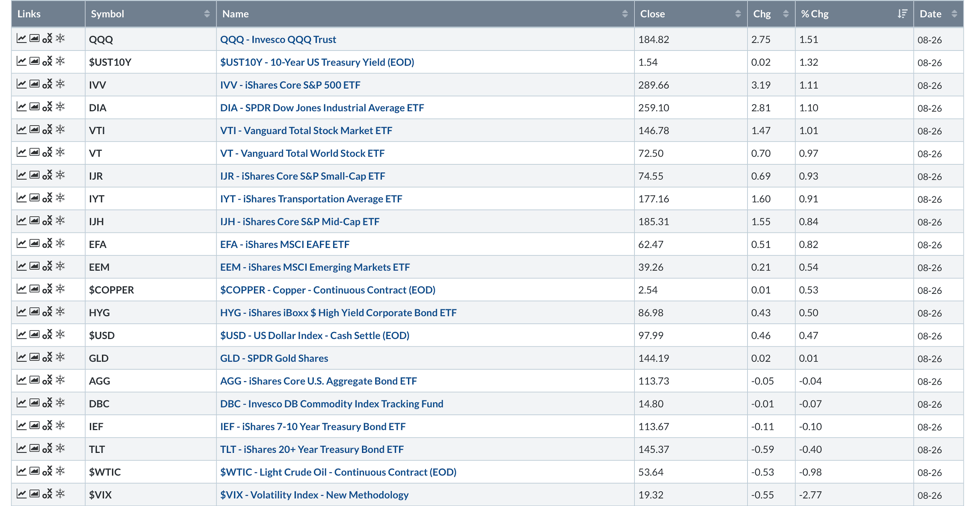
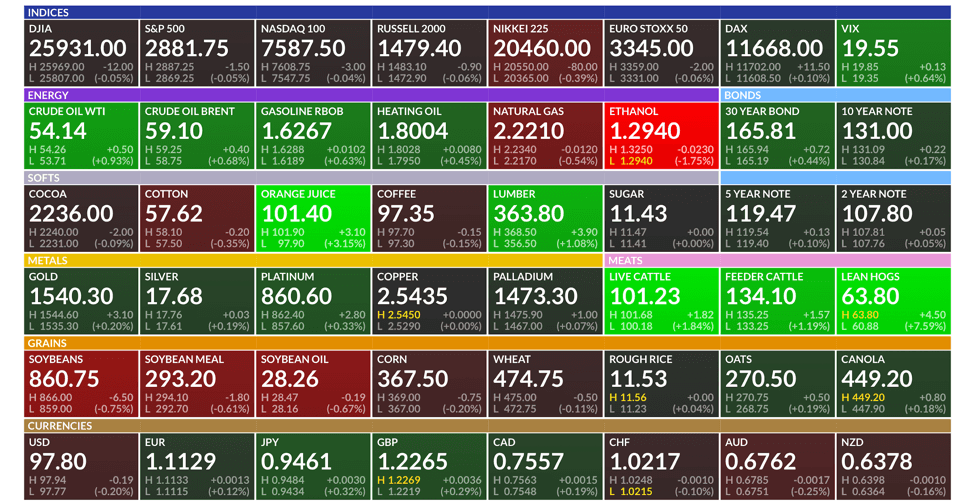
Market Recap: The market rallied yesterday on news that talks with China were back on. The S&P 500 finished higher by 1.11%. The Nasdaq 100 was the strongest broad market segment, closing up 1.51% (QQQ). Treasury bond yields were higher by 2 basis points and long-term Treasuries closed lower by -0.40%.
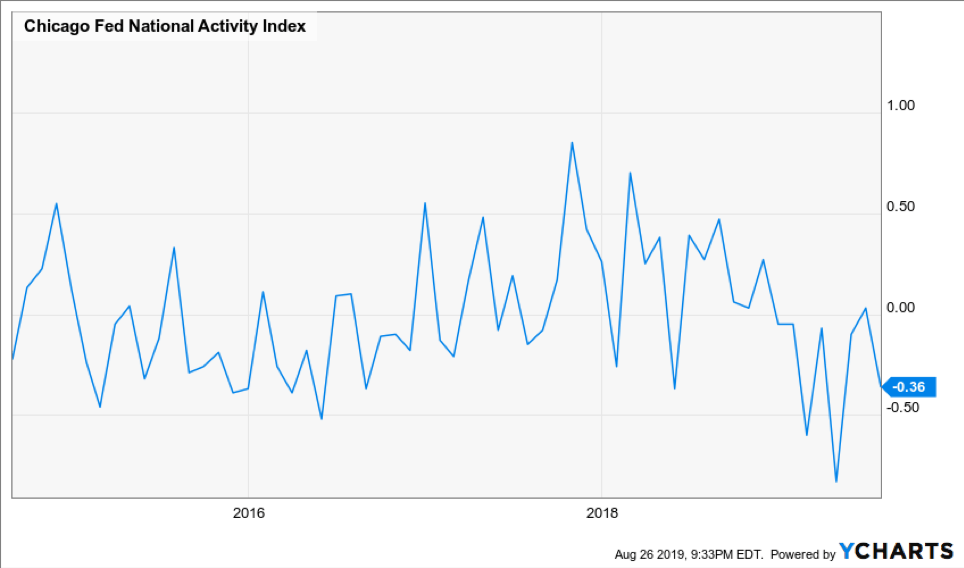
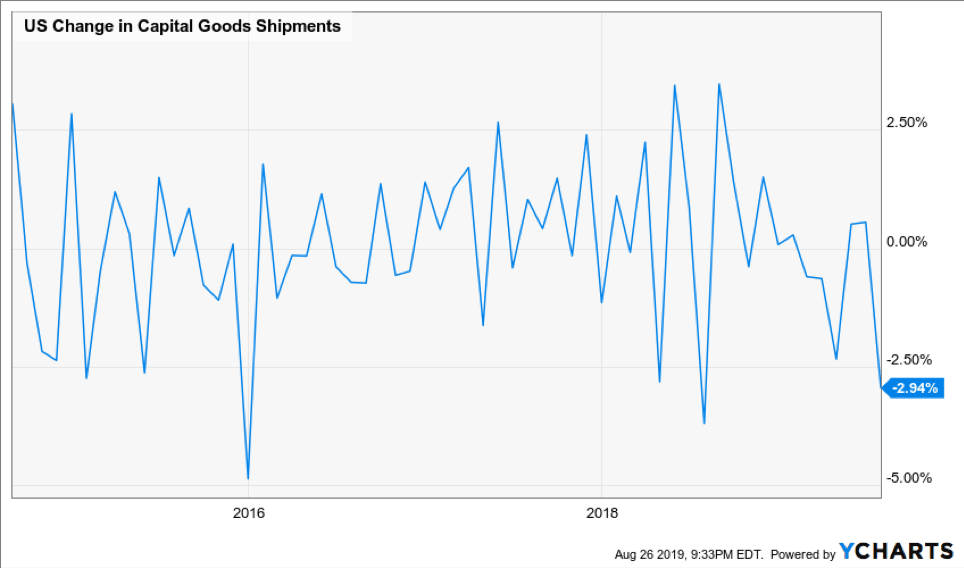
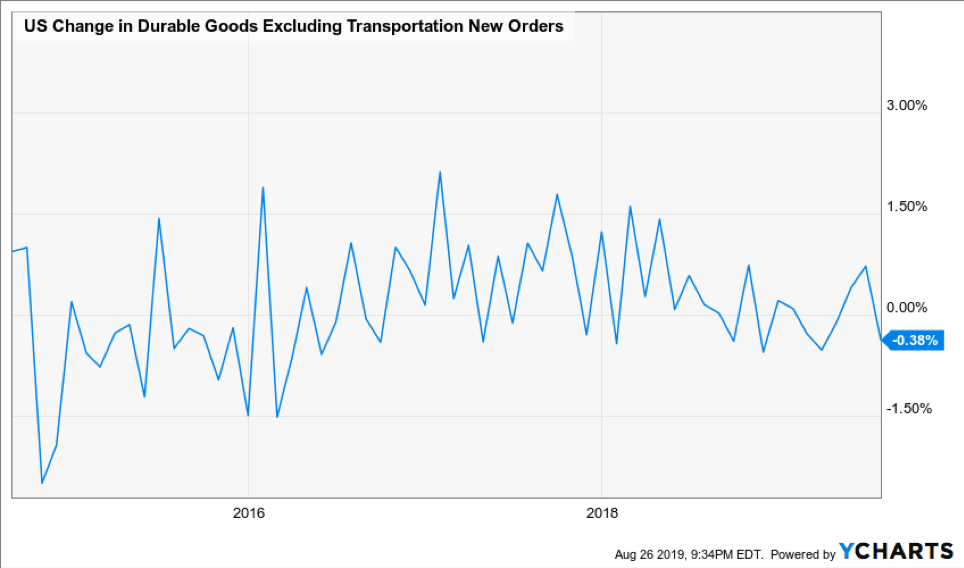
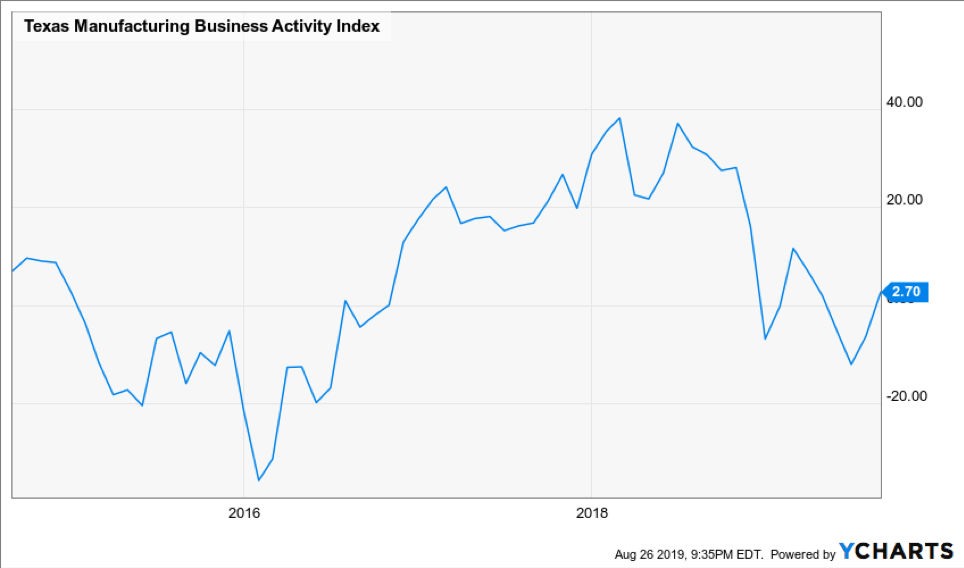
Economic Activity: We had a busy day yesterday in terms of economic activity. The Chicago Fed National Activity index dropped to -0.36, showing a continued slowdown. Capital Goods Shipments were also down, dropping -2.94%. Durable goods (excluding transportation) fell -0.38% last month. The only bright spot was a pick-up in Texas Manufacturing activity, which ticked up last month.
Nasdaq 100 (QQQ): The Nasdaq 100 was the leader yesterday. It remains above the 200-day moving average despite the difficult price action of the last several weeks. With economic growth slowing, we would expect this particular index to reverse into a negative trend. However, that has not been the case as it has been rather resilient.
-637025047044657545.png)
Nasdaq 100 Advance/Decline: Breadth has remained strong in the Nasdaq 100 despite the volatility in equity markets. The cumulative advance/decline line remains above the 200-day moving average. In fact, we would expect the advance/decline line to breakdown if a meaningful correction or market top were upon us. We will be watching this closely.
-637025046299789274.png)
Communications: The communications sector was the top performing sector yesterday. It closed higher by 1.50%. The sector remains above the 200-day moving average and the May low.
-637025045484754665.png)
High Yield: Despite the equity market volatility, high yield bonds have been incredibly strong. In fact, they are at all-time highs. The strength in high yield is something that is typically indicative of a growth accelerating regime and risk seeking behavior. This isn’t what one would expect in the middle of a trade war nor a growth slowing environment.
Price doesn’t always tell the whole story: When you dig a little deeper into the high yield market you can see that spreads have indeed widened considerably this year in the CCC credits. In fact, spreads are near the highs reached last year during the sell-off in December. Spreads, in our experience, have been a leading indicator to equity market volatility.
-637025045053347293.png)
Futures Summary:
News from Bloomberg:
Iran all but ruled out talks with the U.S., saying a meeting with President Trump is "unimaginable" and America must lift sanctions if it wants to negotiate. Tehran is interested in solving problems in a reasonable way but not in a photo-op, President Rouhani said after Trump signaled he'd be open to a shift in policy. Take a look at why the U.S. and Iran are at loggerheads again.
Johnson & Johnson's opioid ruling in Oklahoma gave a green light to other states and cities hoping to win billions of dollars in verdicts with the same arguments. The judge ruled the company's misleading marketing of the drugs created a public nuisance and ordered it to pay $572 million to Oklahoma. It's only a fraction of the $17.5 billion sought by the state, but it's the first affirmation of liability in court of the high-risk legal strategy. The company plans to appeal. Here's a guide to the opioid epidemic.
It's been 24 hours and China still seems unaware of any calls with the U.S., casting doubt on Trump's announcement that they took place over the weekend and prospects for a deal have improved. The Communist Party's People's Daily said in a commentary that the U.S. shouldn't misjudge China's determination to firmly retaliate if America follows through with higher tariffs.
August has been a strong month for macro hedge funds—those that avoided Argentina's meltdown that is. Said Haidar's $650 million fund added 11.6% through Aug. 21, a person familiar said. Crescat Capital's macro fund and the PruLev Global Macro Fund also climbed. But the gains may have come too late for some: About $12.8 billion was pulled from macro funds through July, eVestment said.
U.S. stock-index futures fell, while haven assets gained as Germany's collapsing exports added to concern the trade war is wreaking havoc on the global economy. Asian shares rose and the yuan weakened. Yields on 10-year Treasuries fell to 1.50% and the dollar weakened. Oil rebounded.
Author

Clint Sorenson, CFA, CMT
WealthShield


