The major indices have a strong down day – What's next for Nasdaq?

Recap 4/21 – Thursday, the S&P opened with a 30 handle gap up and then rallied another 23 handles into a 9:51 AM high of the day. From that high, the S&P declined 128 handles into a 3:50 PM low of the day. From that low, the S&P bounced 12 - 17 handles into the close.
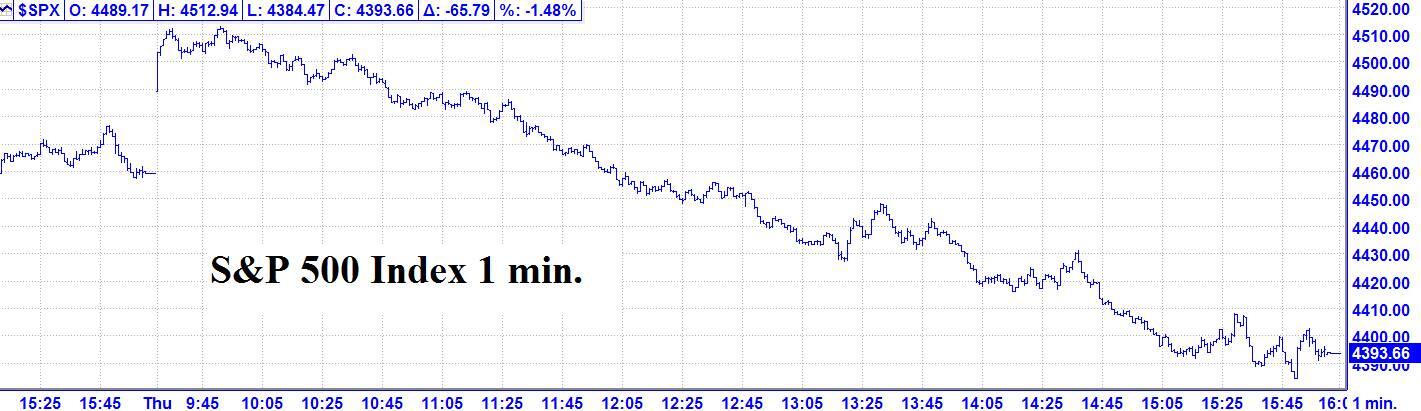
4/21 – Following a large up opening, the major indices reversed to have a very strong down day to finish with the following closes: INDU - 368.03; S&P 500 – 65.79 : and the NASDAQ Composite - 278.41.
Looking ahead - Wednesday’s close offered a murky set up into our 4/20 AC change in trend. I heard from some of you that you sold the up open on Thursday and did well. Way to go! Our next change in trend is due 4/22 AC. Please see details below.
The Now Index has moved to the BUY ALERT ZONE. This is indicating a moderate imbalance of too many shorts. This is not an outright buy signal, but rather a caution signal for the bears.
Coming events
(Stocks potentially respond to all events).
4. A. 4/20 AC – Moon’s North Node 90 Saturn. Major change in trend Cattle, Copper, Coffee, Cotton, Silver.
B. 4/22 AC– Helio Mars enters Aquarius. Important change in trend Copper.
C. 4/22 AC – Jupiter Parallel US Moon. Major change in trend US Stocks, T-Bonds, US Dollar.
5. A. 4/27 AC – Neptune 120 US Mercury. Major change in trend US Stocks, T-Bonds, US Dollar.
B. 4/28 AC – Jupiter 60 US Pluto. Moderate change in trend US Stocks, T-Bonds, US Dollar.
C. 4/28 AC – Mercury Maximum Elongation East. Corn, Oats, Soybeans, Wheat.
D. 4/29 AM – Pluto in Capricorn turns Retrograde. Major change in trend Cocoa, Hogs, T-Bonds.
E. 4/29 AC – Solar Eclipse in Taurus. Major change in trend Financials, Grains, Precious Metals, Cattle, Cotton.
F. 4/29 AC – Jupiter 45 US MC. Moderate change in trend US Stocks, T-Bonds, US Dollar.
G. 5/04 AC – Saturn 150 US Mercury. Moderate change in trend US Stocks, T-Bonds, US Dollar.
H. 5/04 AC – Uranus 150 US Saturn. Moderate change in trend US Stocks, T-Bonds, US Dollar.
Stock market key dates
DJIA* – 4/26.
Fibonacci – 4/21, 4/29.
Astro – 4/25, 4/28, 4/29, 4/29 AC.
Please see below the S&P 500 10 minute chart.
Support - 4370, 4320, 4282 Resistance – 4490.
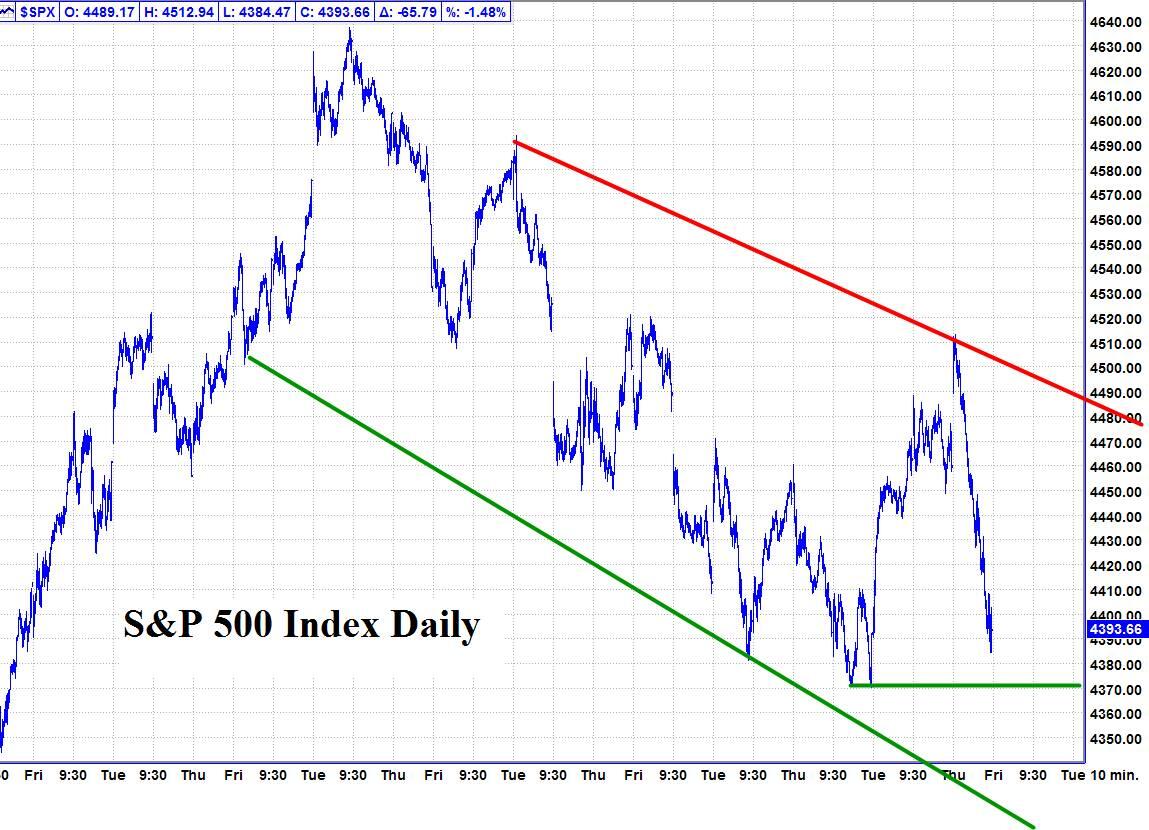
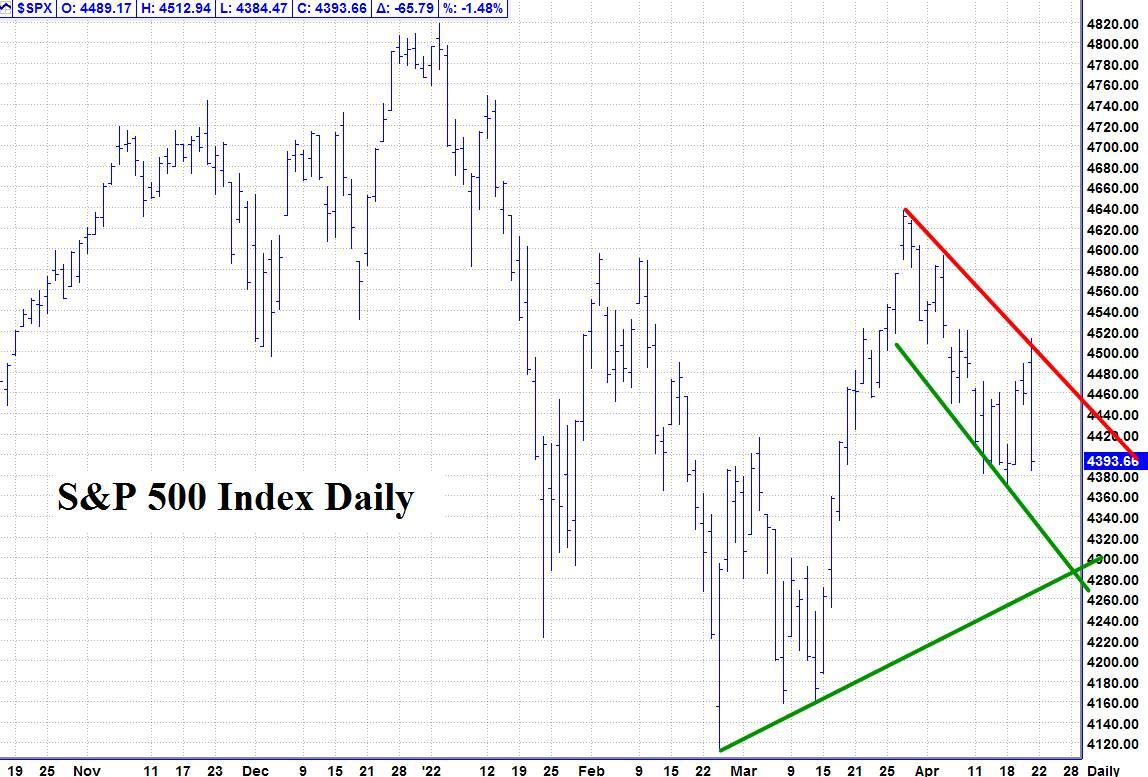
Please see below the S&P 500 Daily chart.
Support - 4370, 4320, 4282 Resistance – 4490.
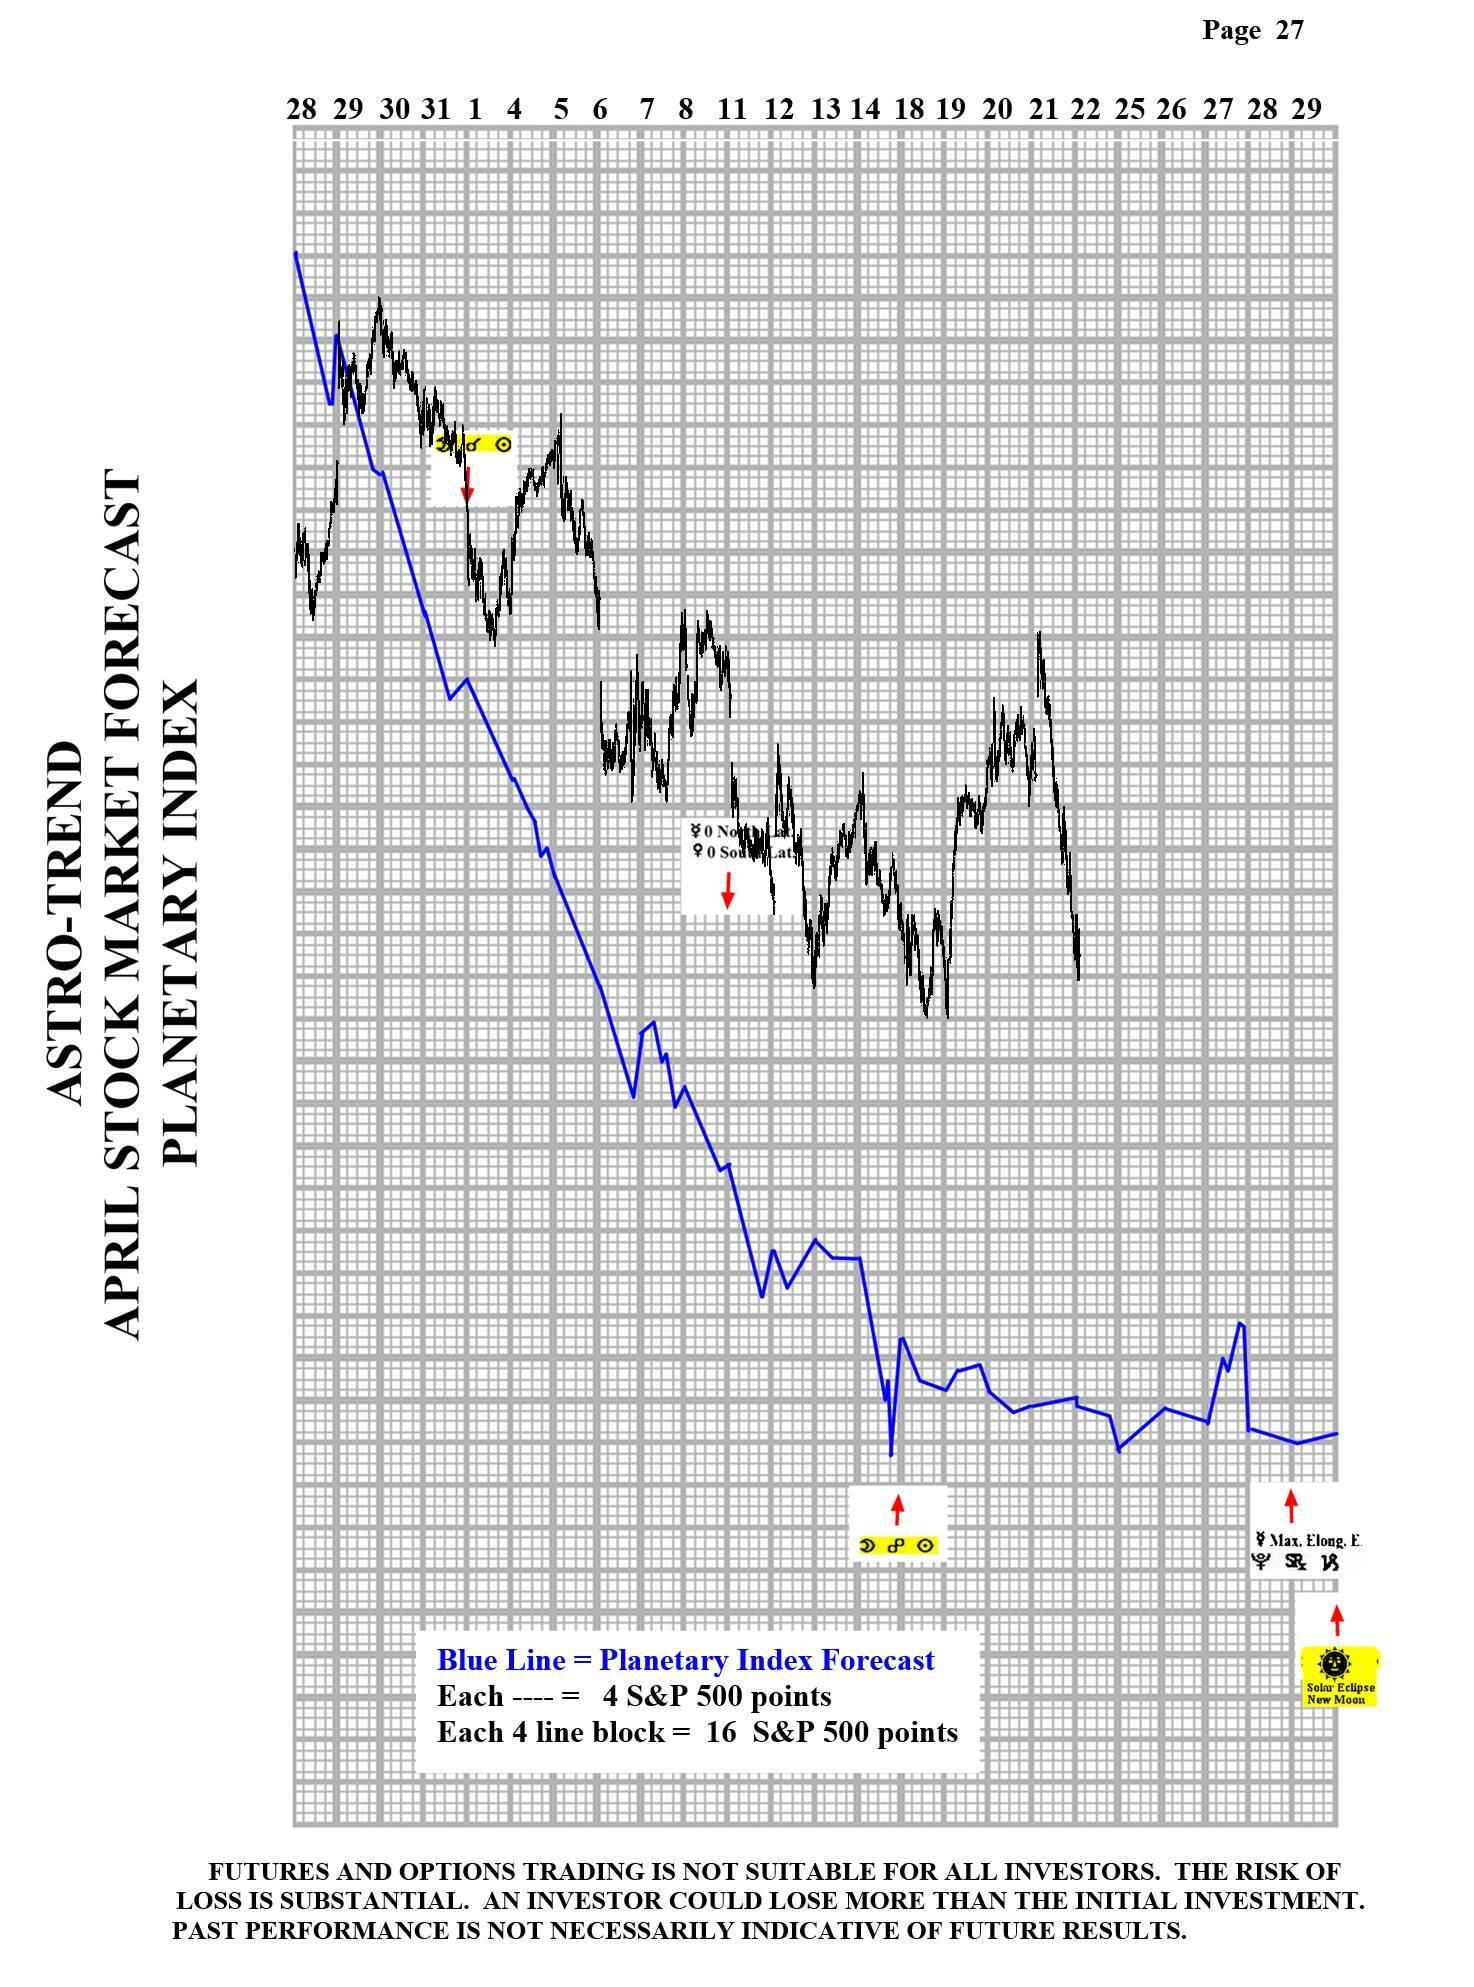
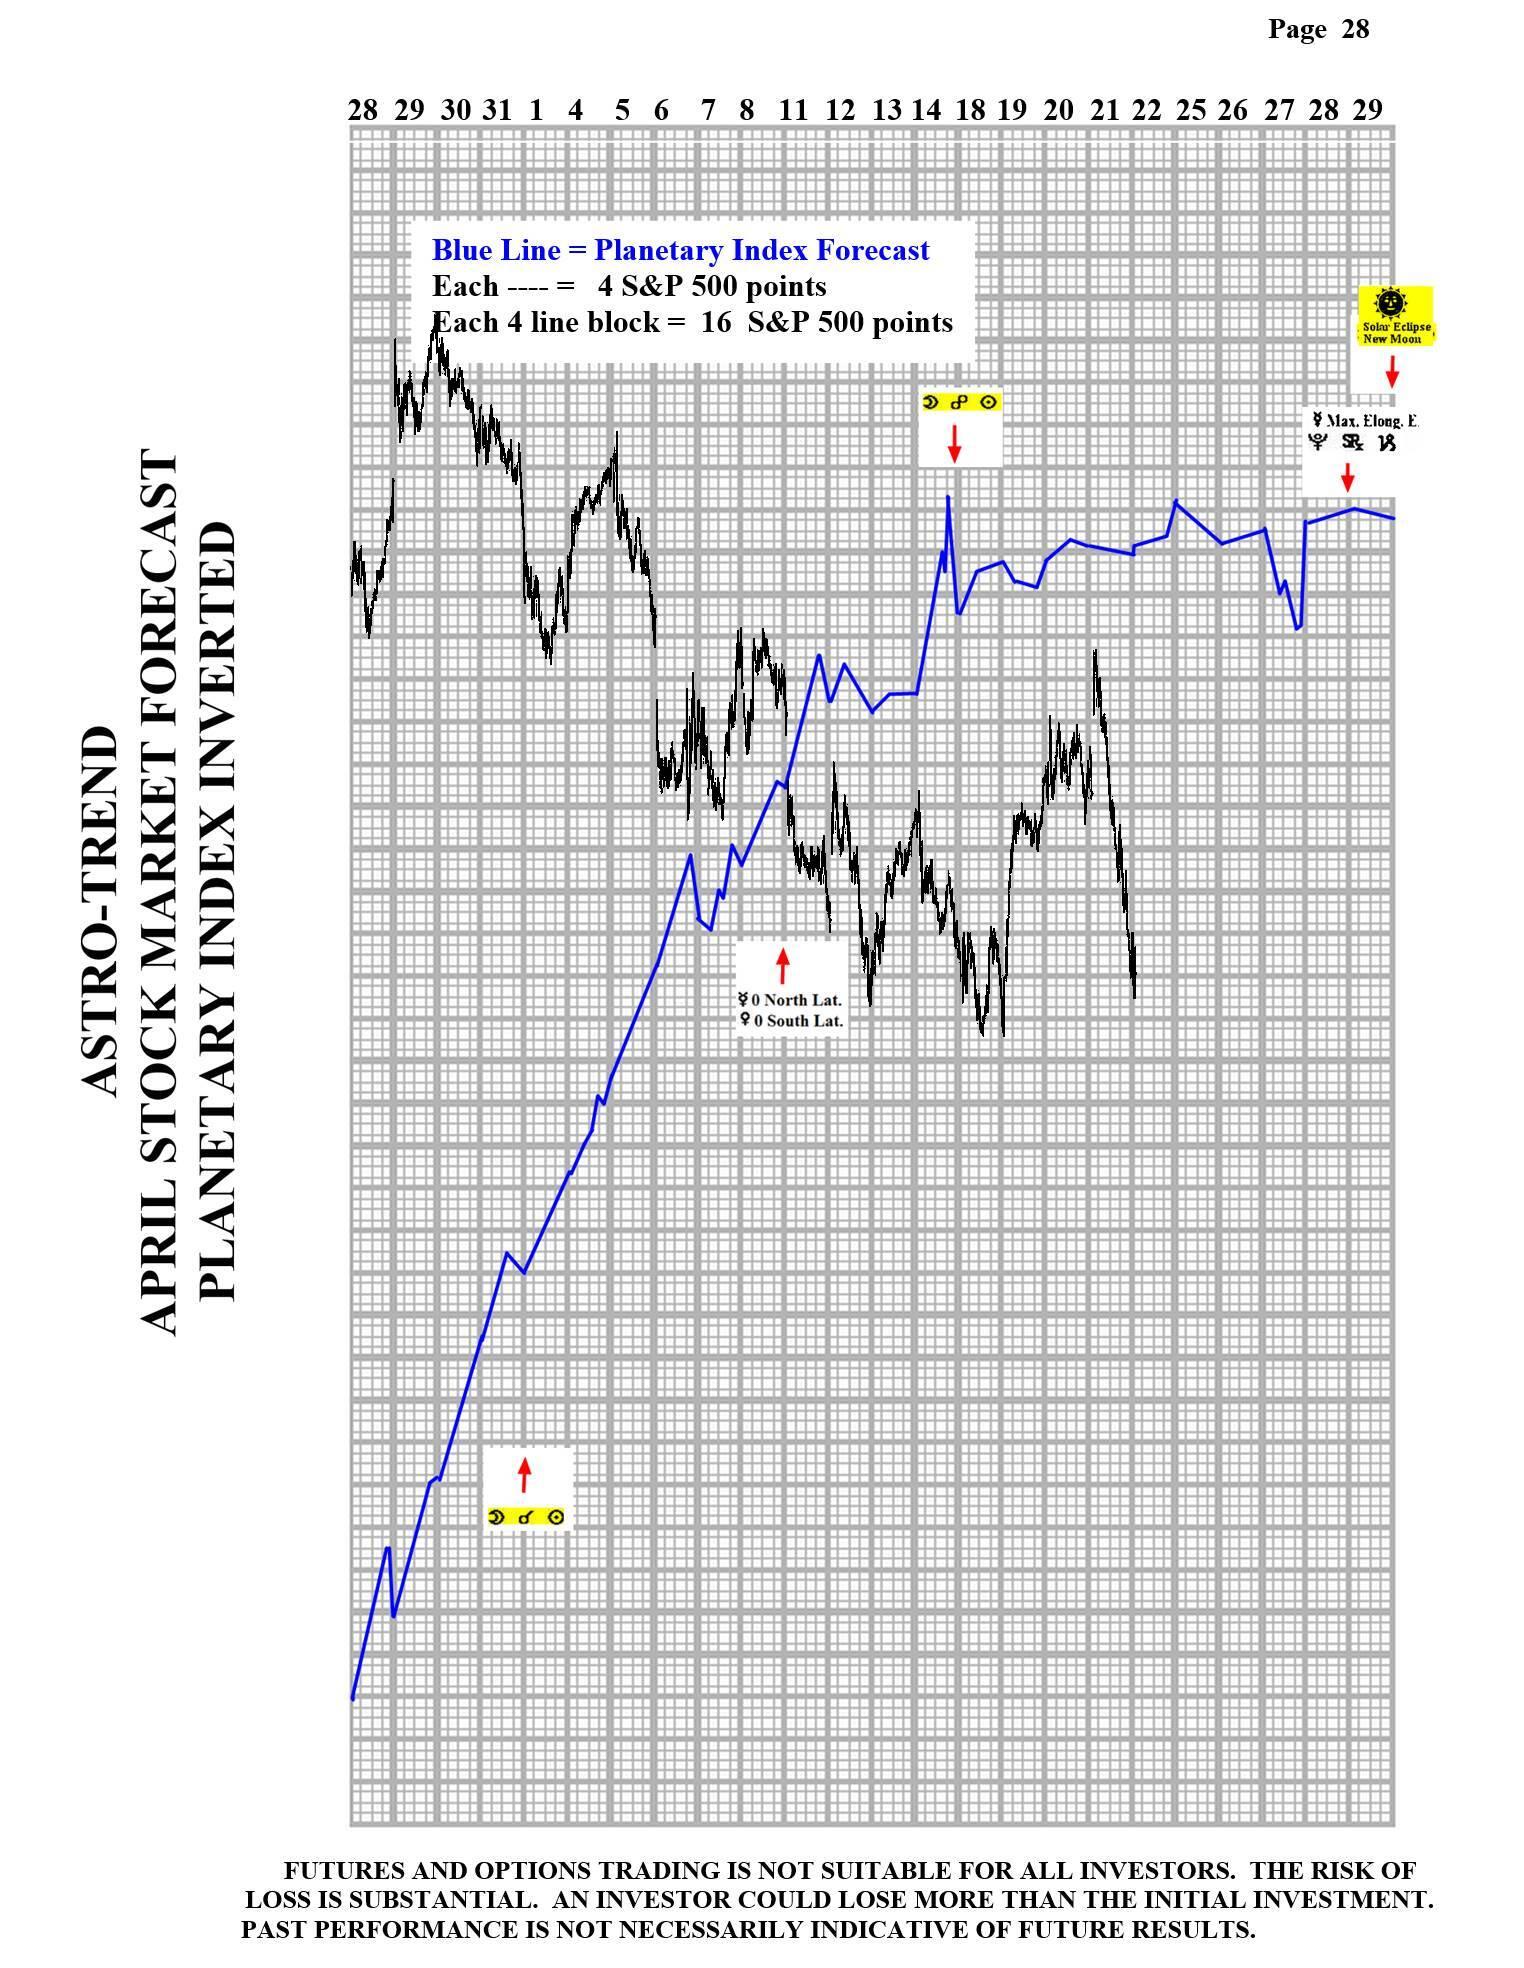
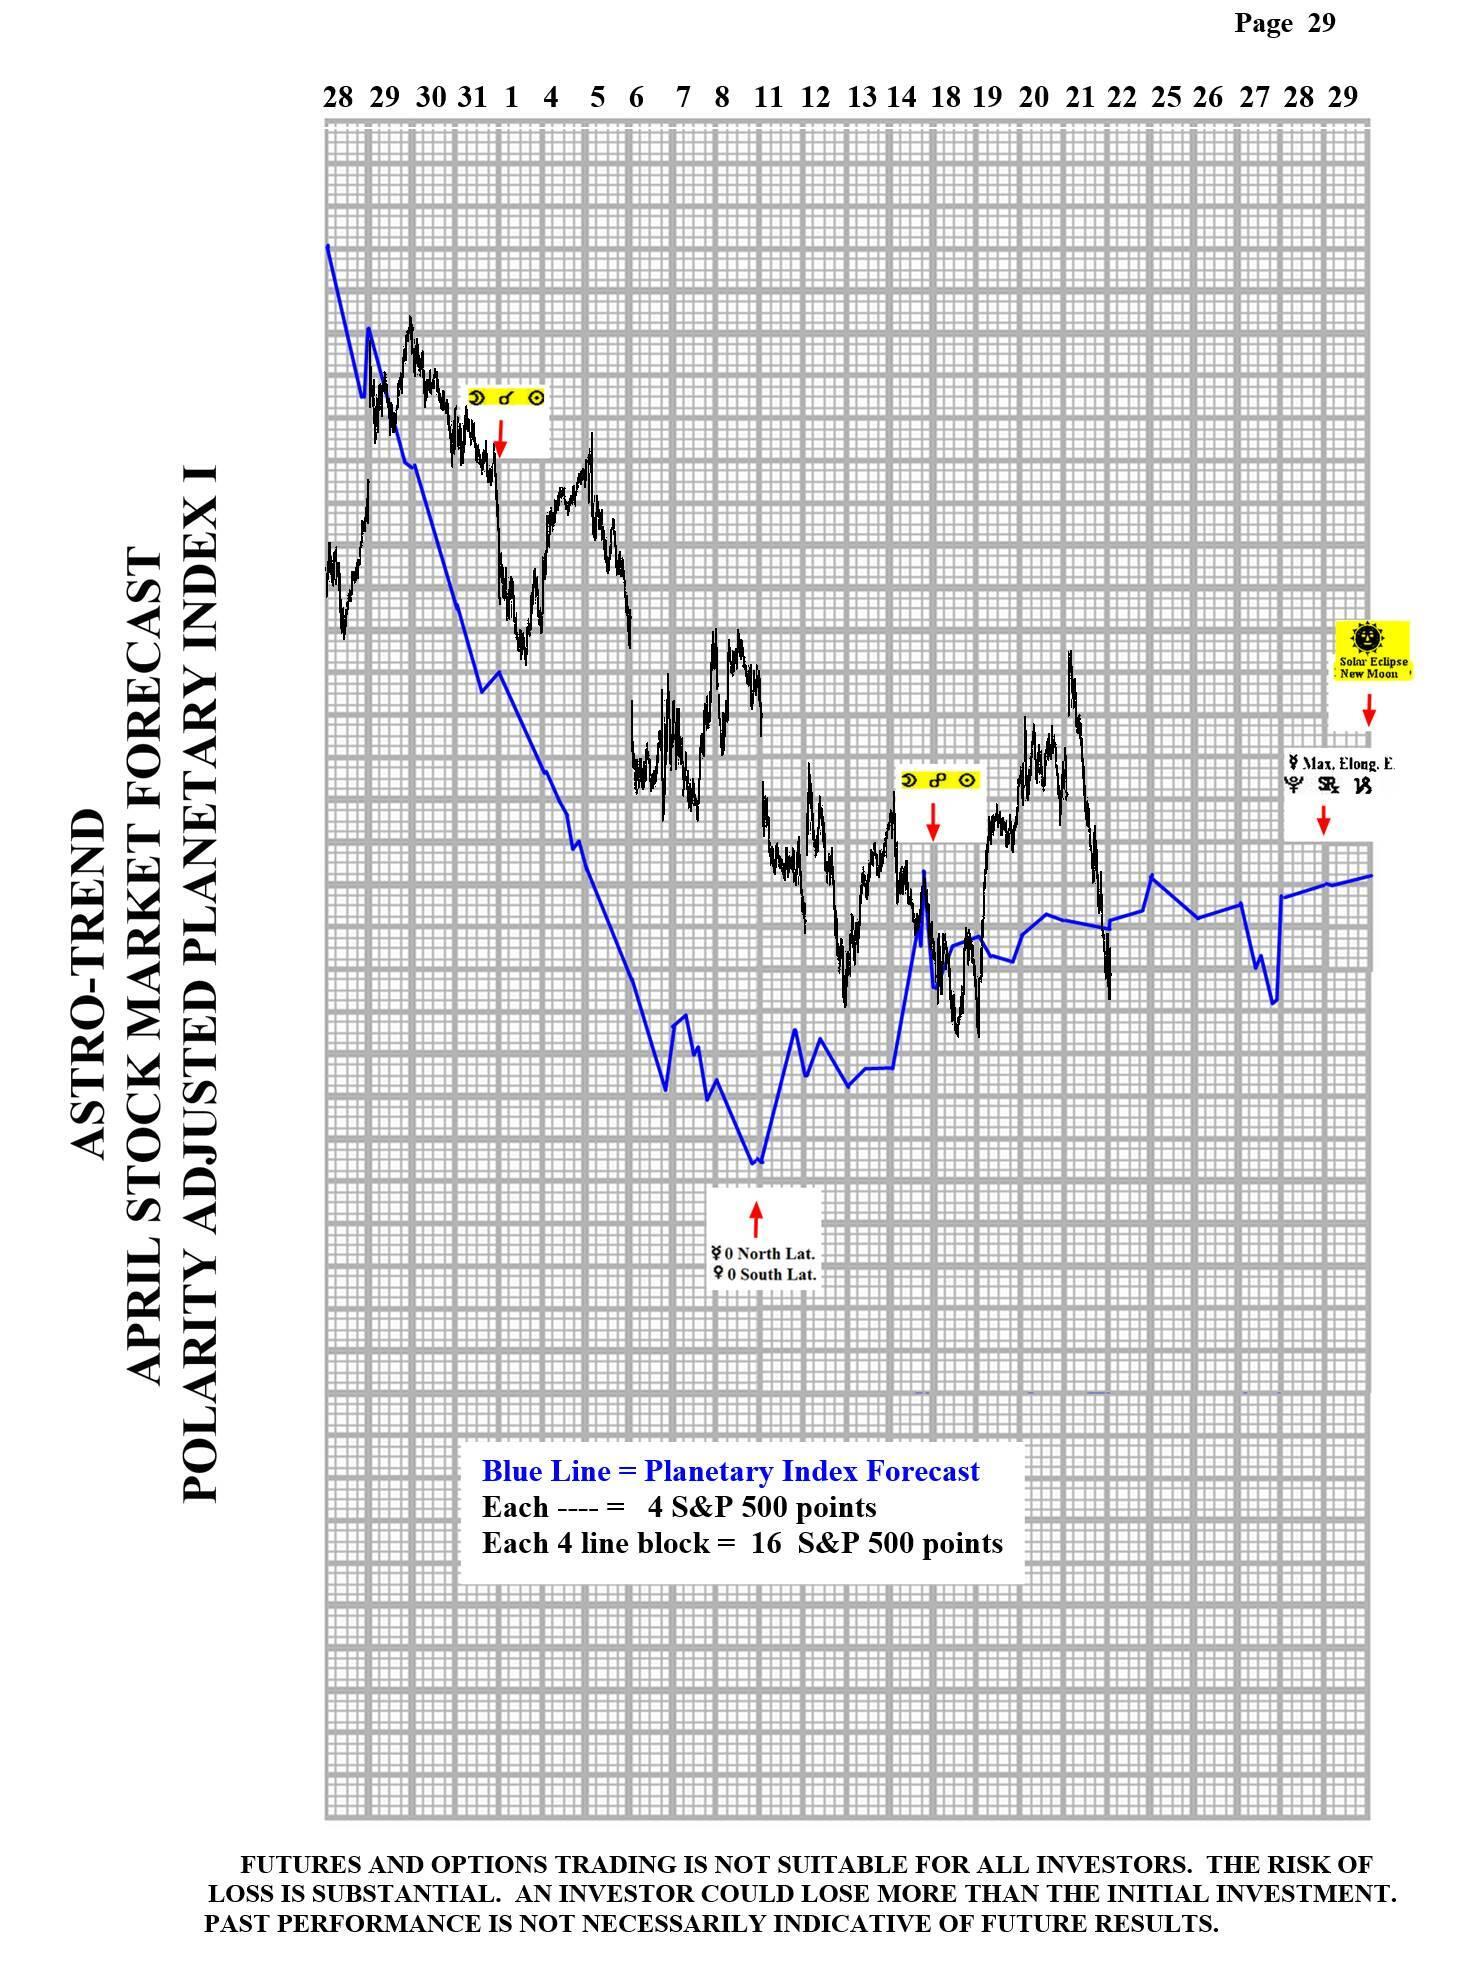
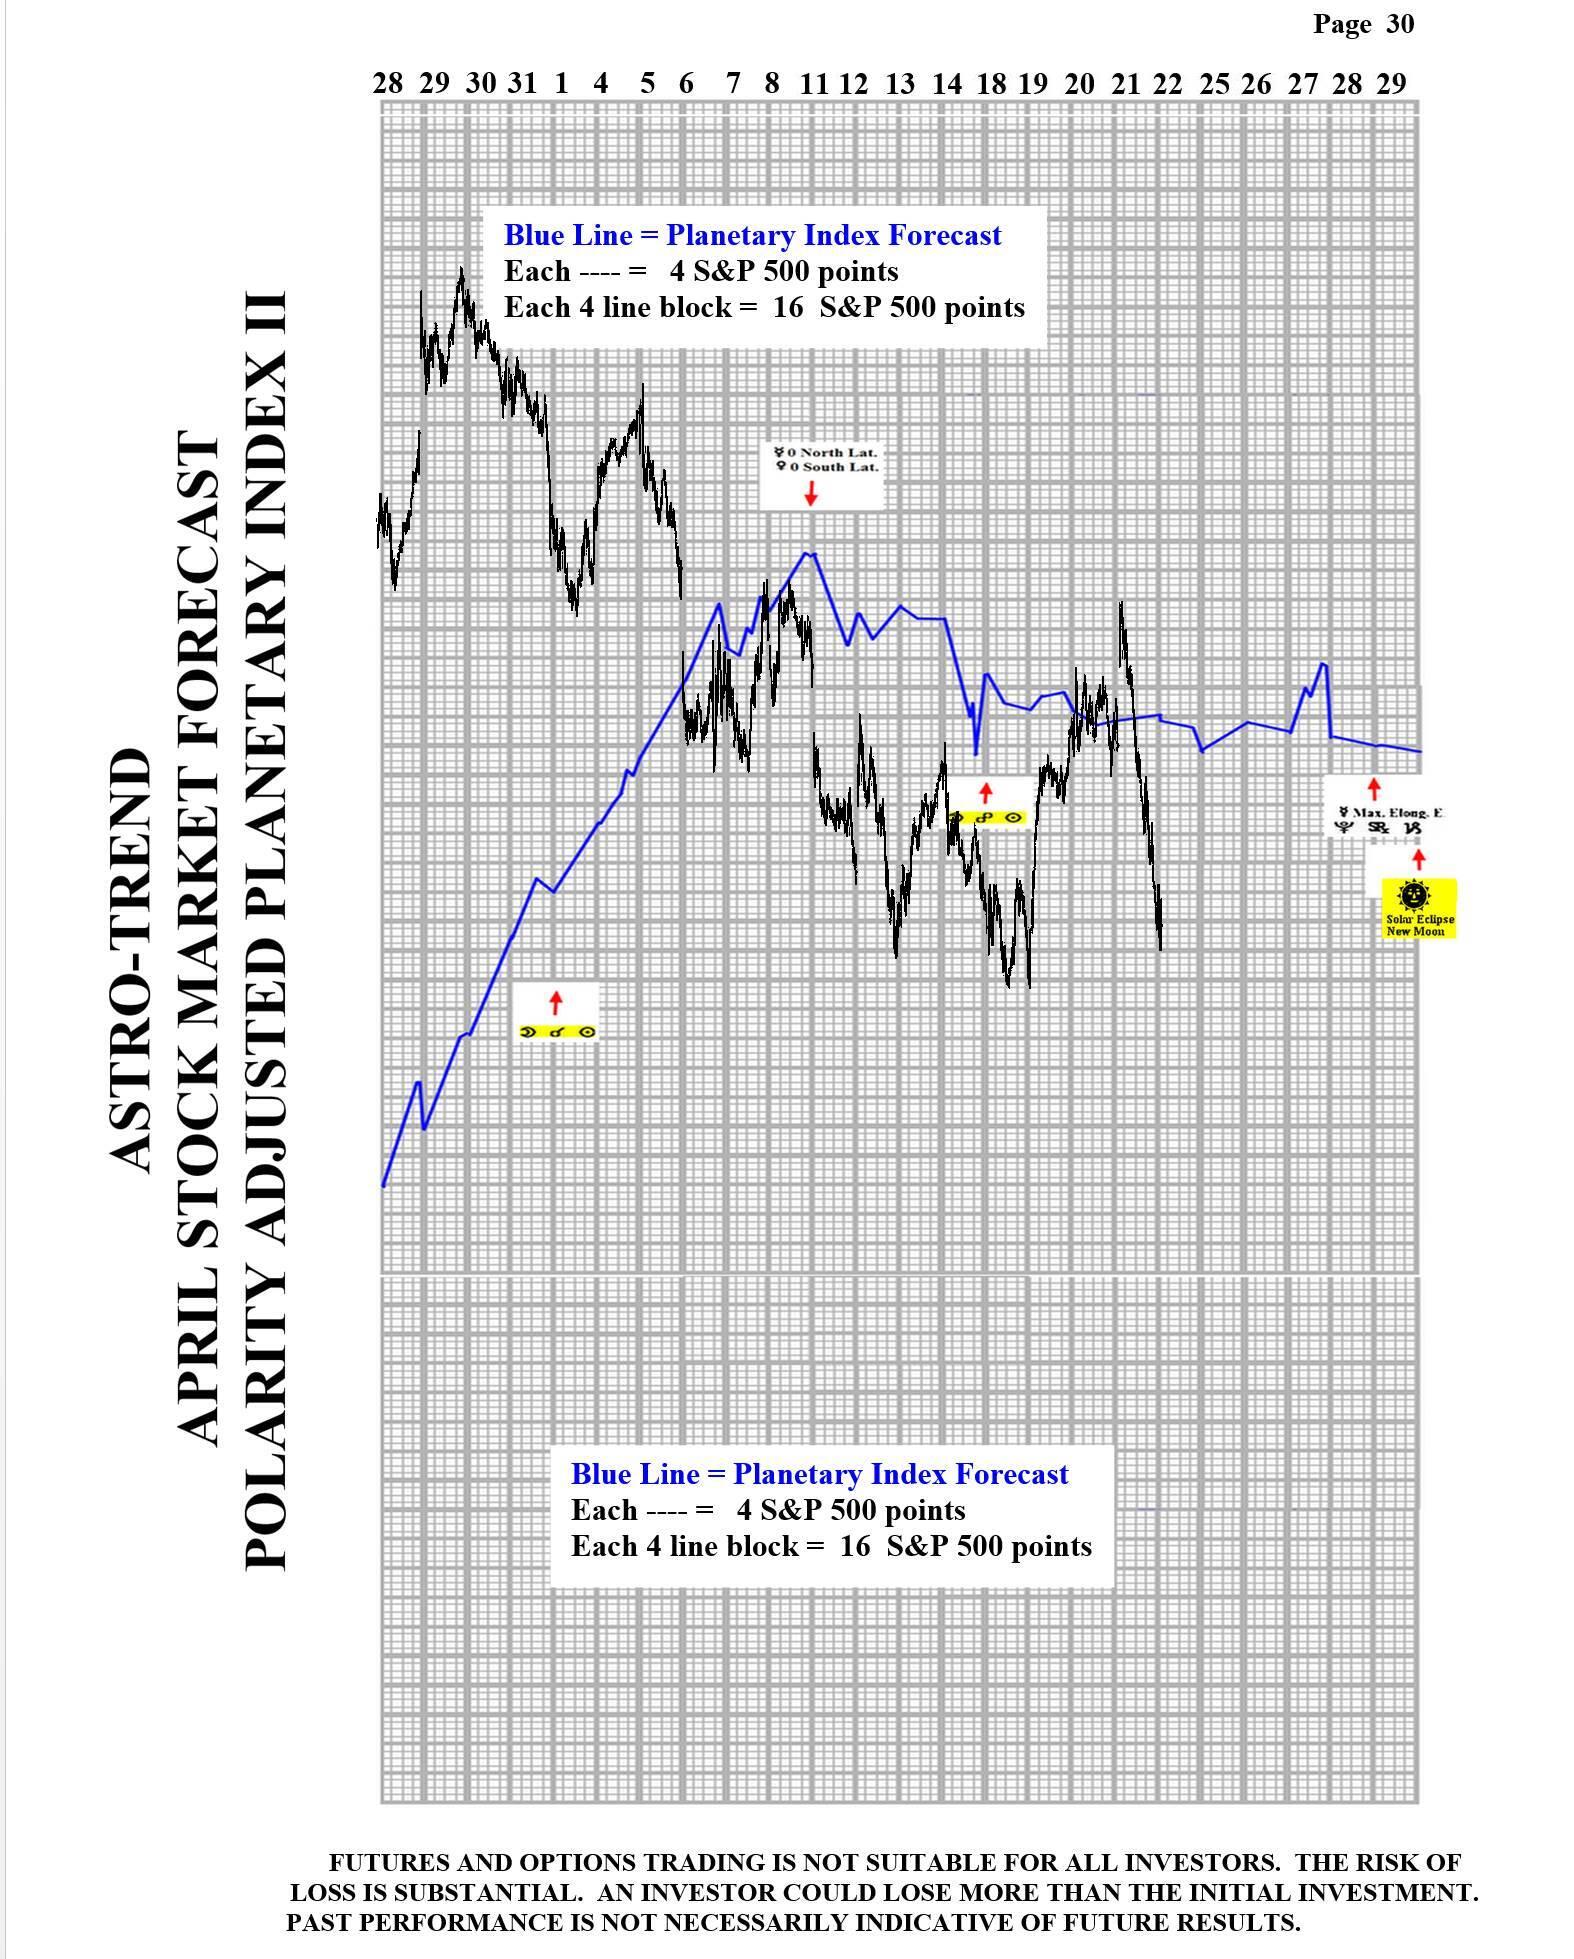
Please see below the March Planetary Index charts with S&P 500 10 minute bars for results.
Author

Norm Winski
Independent Analyst
www.astro-trend.com


