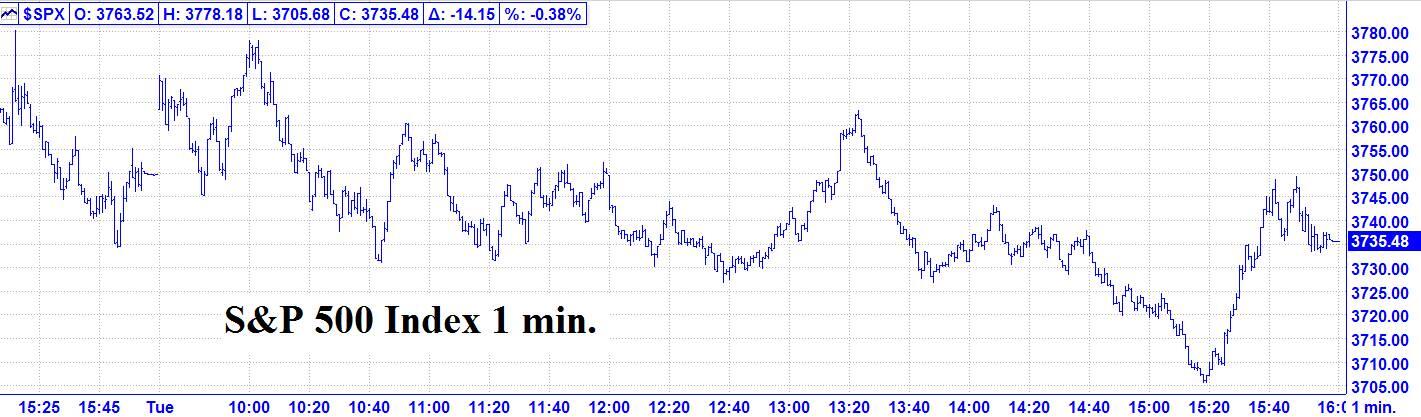
Recap 6/14 – Tuesday, the S&P opened with a 14 handle gap up and then declined 14 handles into a 9:41 AM low. From that low, the S&P rallied 28 handles into a 10:00 AM high of the day. From that high, the S&P zig zagged 51 handles into a 12:40 PM low. From that low, the S&P rallied 36 handles into a 1:23 PM high. From that high, the S&P declined 57 handles into a 3:19 PM low of the day. From that low, the S&P rallied 43 handles into a 3:49 PM high. From that high, the S&P declined 9 handles into the close.

Chart

6/14 – The major indices had a somewhat mixed day with the DJIA and S&P etching a small to moderate down day. The Nasdaq finished with a very small up day. Here are closes: DJIA - 151.91; S&P 500 - 14.15; and the Nasdaq Composite + 19.12.

Looking ahead - Our next change in trend window is 6/14 AC with three Astro events. Please see the details below.

The Now Index had retreated to the BUY ALERT ZONE. It indicates that there is a moderate imbalance of many shorts. It is not an outright buy signal. The two recent BUY signals were not effective.

Coming events

(Stocks potentially respond to all events).

3. B. 6/14 AC – Moon’s North Node 45 US Jupiter. Moderate change in trend US Stocks, T-Bonds, US Dollar.

C. 6/14 AC – Jupiter 45 Moon’s North Node. Moderate change in trend Cattle, Cotton, Oats, Silver.

D. 6/14 AC – Jupiter 90 US Jupiter. Major change in trend US Stocks, T-Bonds, US Dollar.

4. A. 6/16 AM – Mercury Maximum Elongation West. Major change in trend Corn, Oats, Soybeans, Wheat.

B. 6/17 AC – Saturn Parallel Neptune. Major change in trend Coffee, Copper, Commodity Index, OIL.

C. 6/17 AC – Mars Perihelion. Major change in trend Corn, Gold, Oj.

D. 6/17 AC – Jupiter Contra-Parallel Latitude US Neptune. Major change in trend US Stocks, T-Bonds, US Dollar, Oil.

Stock market key dates 

Market Math

6/18 (Sat.) = 17,358 Music days > 12/09/1974 MAJOR LOW.

*DJIA – 6/27.

Fibonacci – 6/16, 6/21, 6/27.

Astro – 6/14, 6/15, 6/16, 6/21, 6/28, 6/29, 7/1 AC.

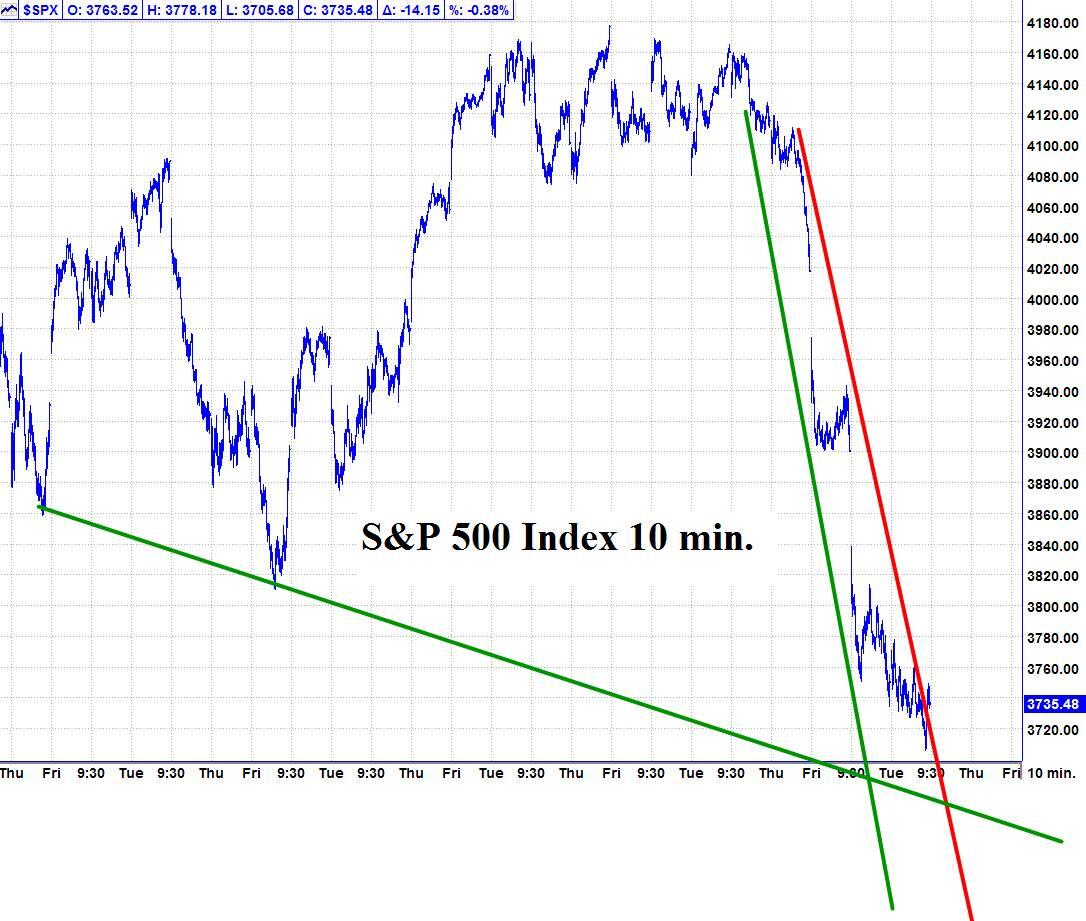
Please see below the S&P 500 10 minute chart.

Support - 3700, 3650 Resistance – 3790.

Chart

Please see below the S&P 500 Daily chart.

Support - 3700, 3650 Resistance – 3790.

Chart

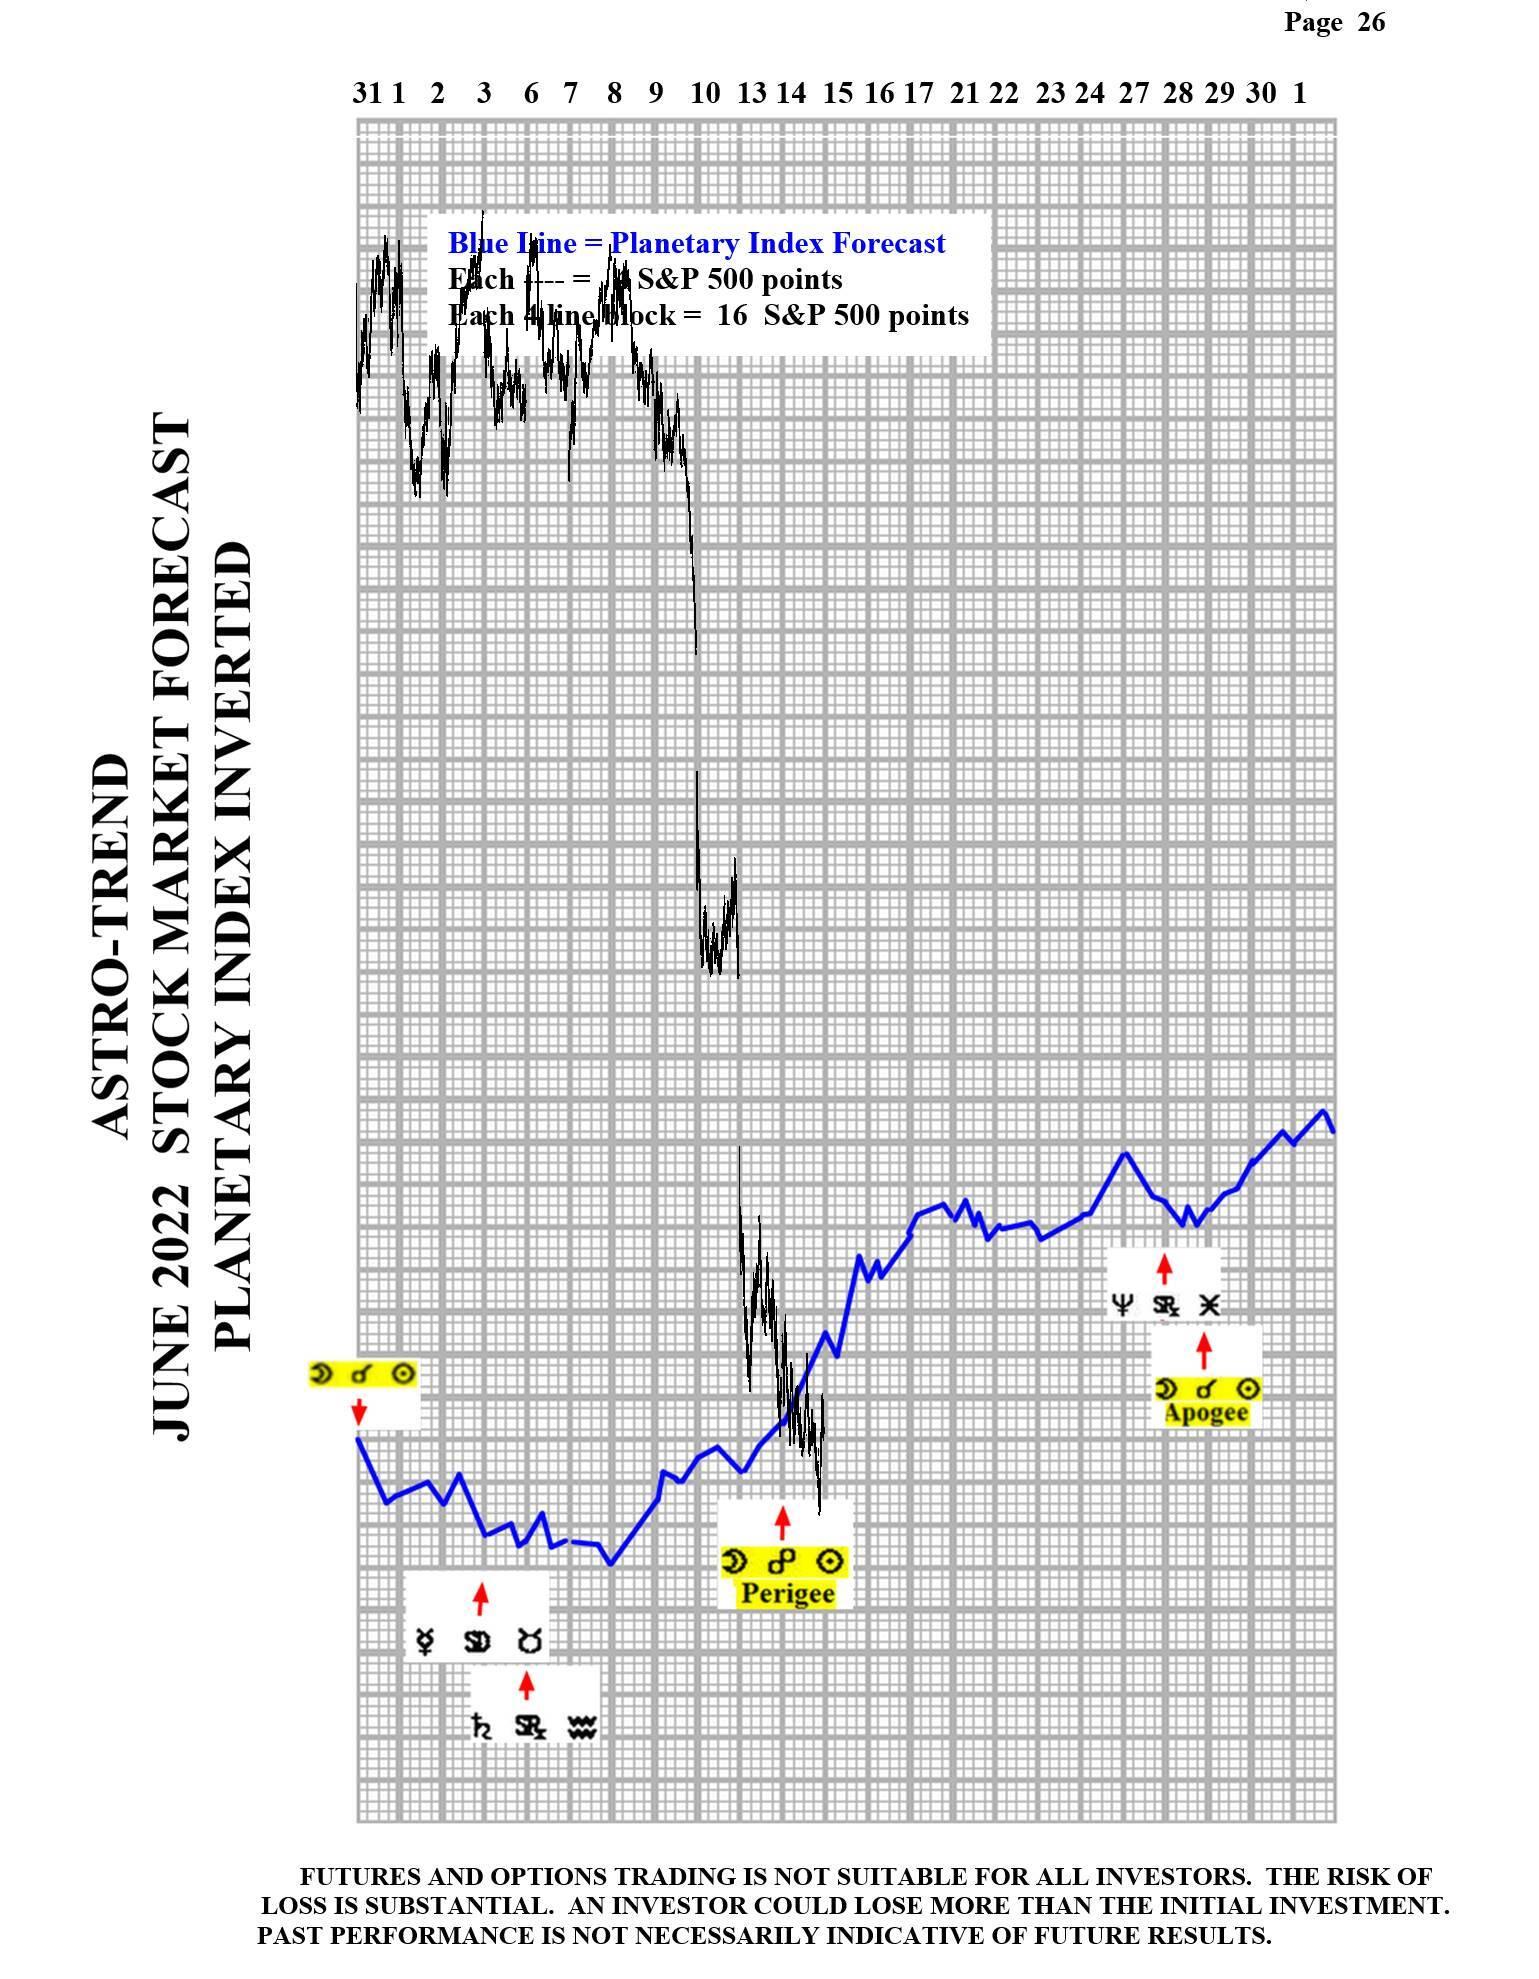
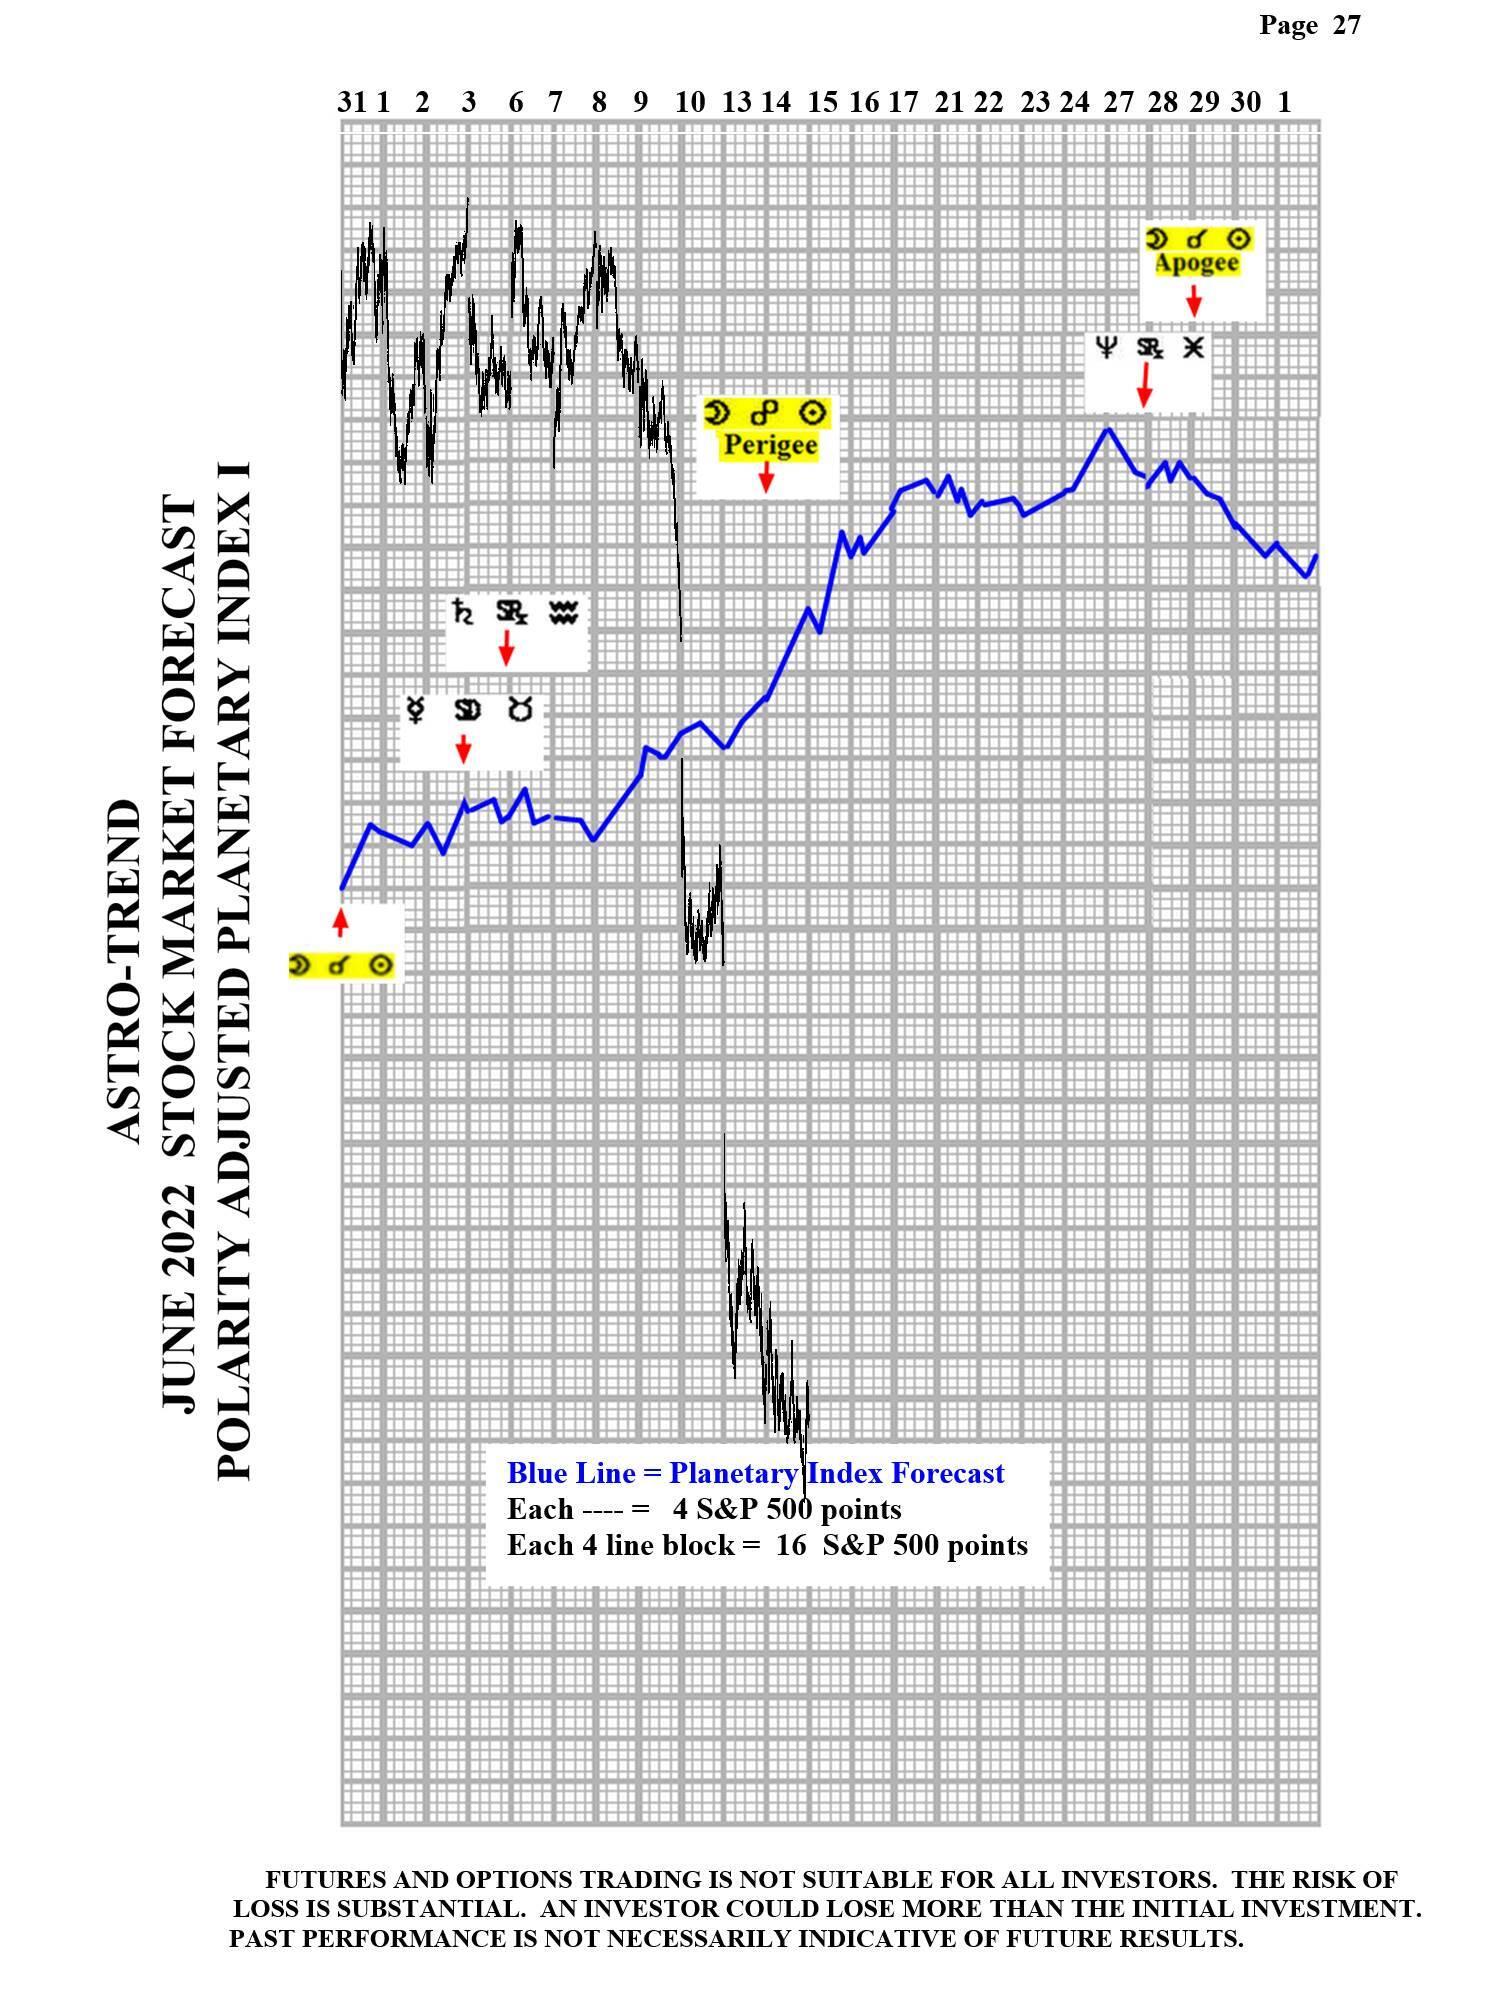
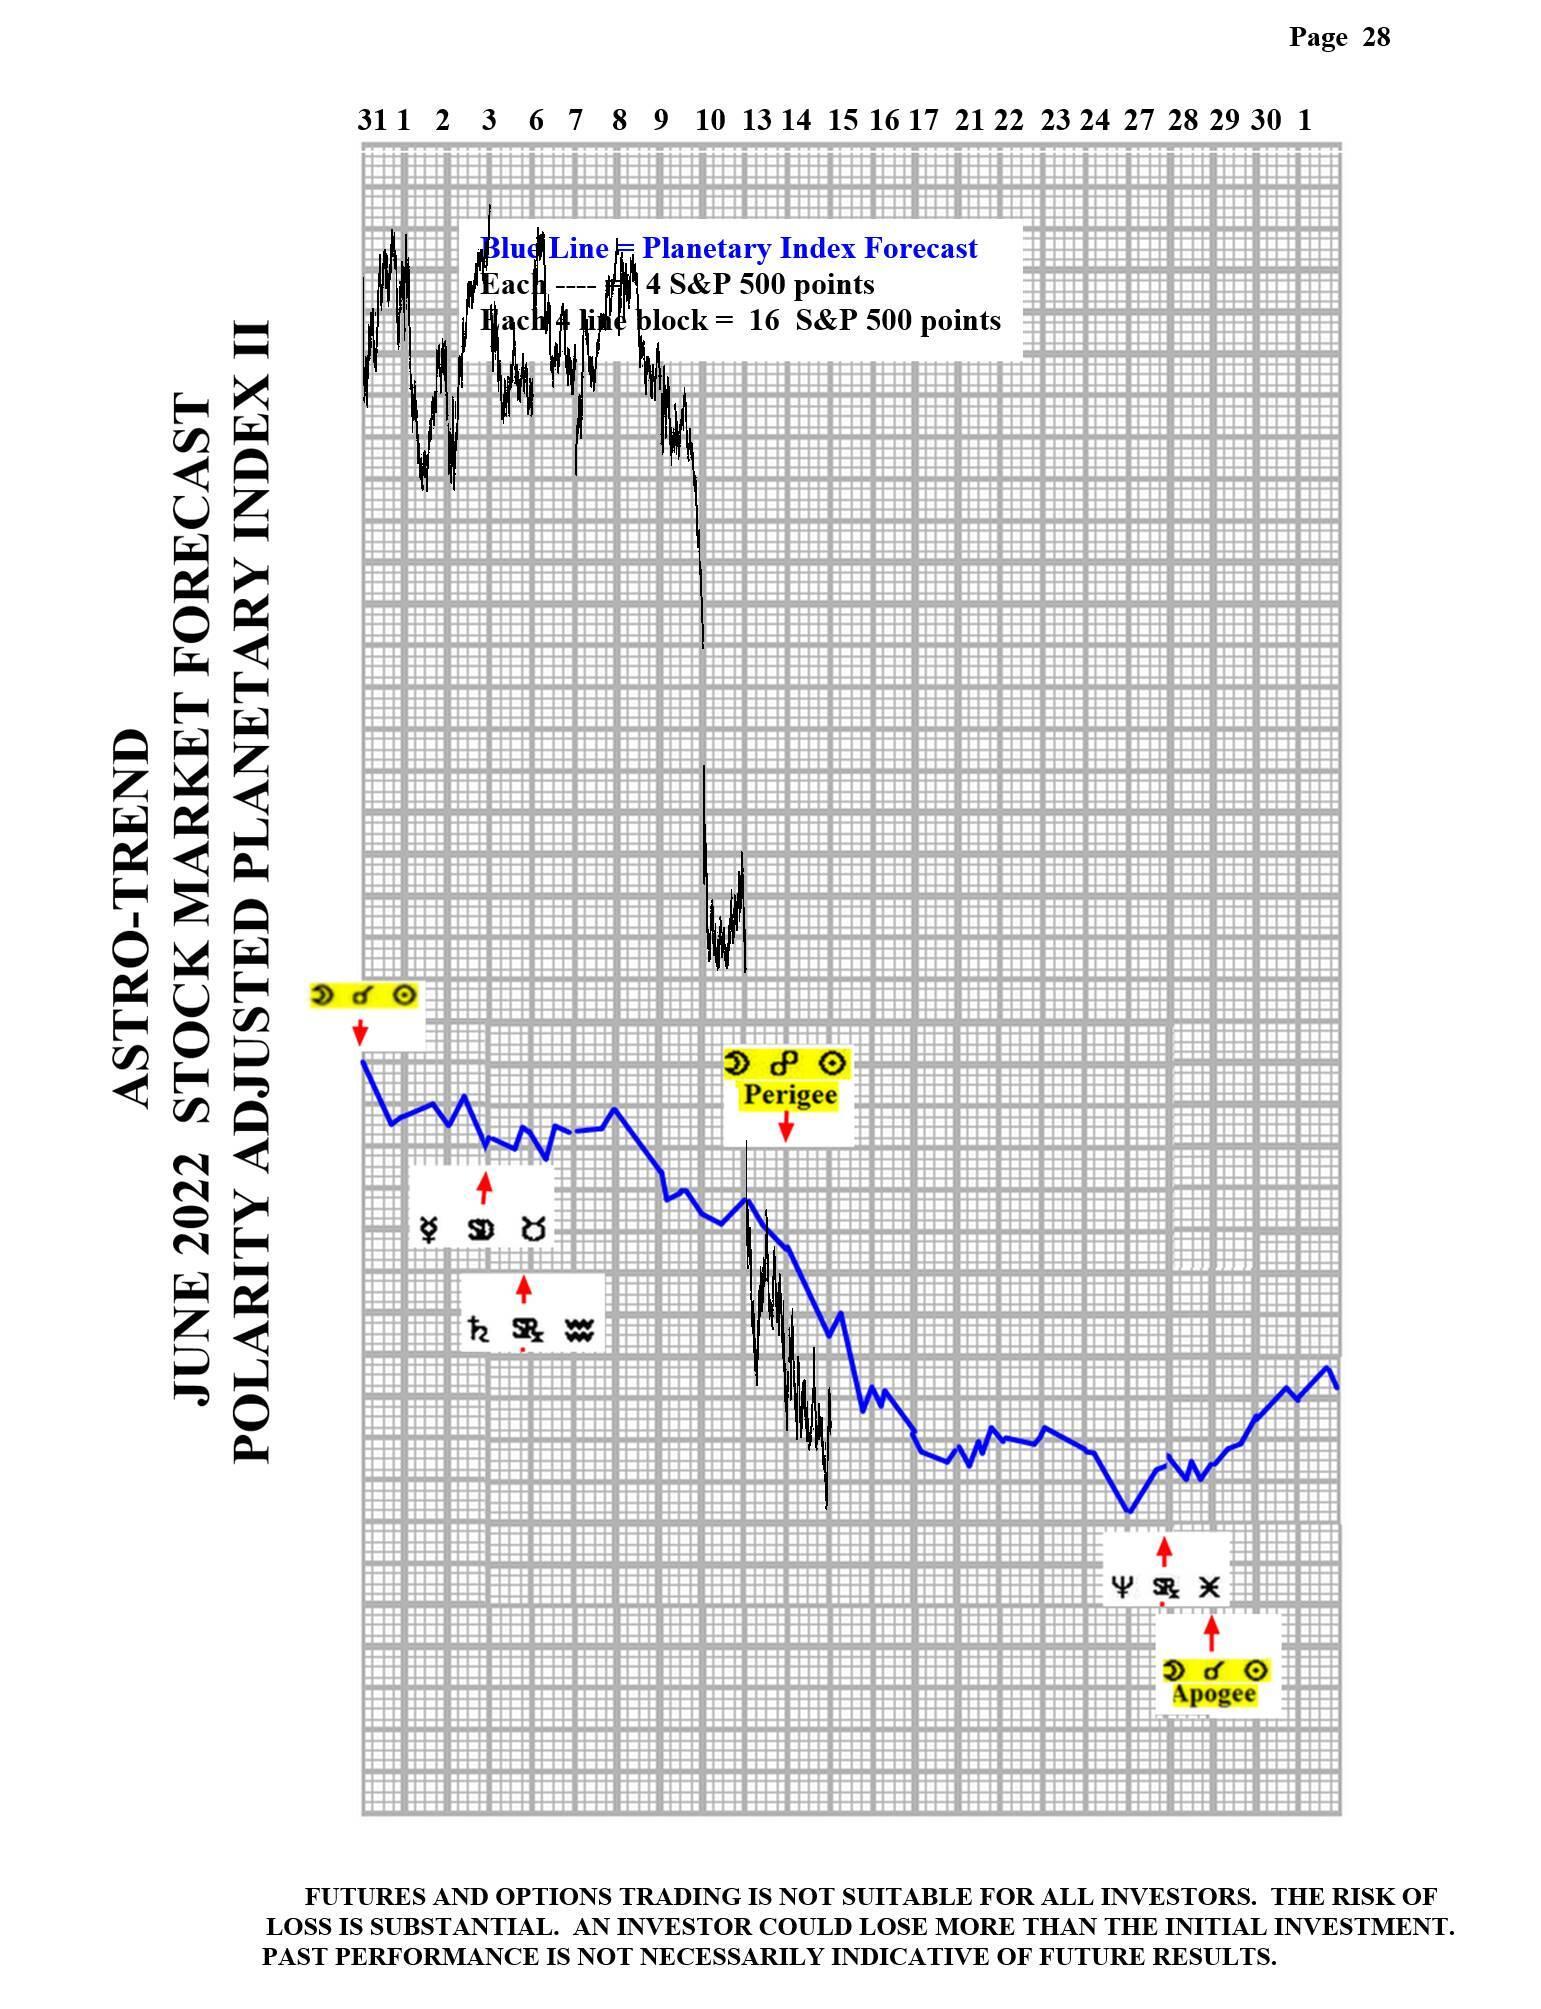
Please see below the June Planetary Index chart with S&P 500 5 minute bars for results.

ChartChartChartChart

Note: All information on this page is subject to change. The use of this website constitutes acceptance of our user agreement. Please read our privacy policy and legal disclaimer. Opinions expressed at FXstreet.com are those of the individual authors and do not necessarily represent the opinion of FXstreet.com or its management. Risk Disclosure: Trading foreign exchange on margin carries a high level of risk, and may not be suitable for all investors. The high degree of leverage can work against you as well as for you. Before deciding to invest in foreign exchange you should carefully consider your investment objectives, level of experience, and risk appetite. The possibility exists that you could sustain a loss of some or all of your initial investment and therefore you should not invest money that you cannot afford to lose. You should be aware of all the risks associated with foreign exchange trading, and seek advice from an independent financial advisor if you have any doubts.

Recommended Content


Recommended Content

Editors’ Picks

EUR/USD clings to daily gains above 1.0650

EUR/USD clings to daily gains above 1.0650

EUR/USD gained traction and turned positive on the day above 1.0650. The improvement seen in risk mood following the earlier flight to safety weighs on the US Dollar ahead of the weekend and helps the pair push higher.

EUR/USD News

GBP/USD recovers toward 1.2450 after UK Retail Sales data

GBP/USD recovers toward 1.2450 after UK Retail Sales data

GBP/USD reversed its direction and advanced to the 1.2450 area after touching a fresh multi-month low below 1.2400 in the Asian session. The positive shift seen in risk mood on easing fears over a deepening Iran-Israel conflict supports the pair.

GBP/USD News

Gold holds steady at around $2,380 following earlier spike

Gold holds steady at around $2,380 following earlier spike

Gold stabilized near $2,380 after spiking above $2,400 with the immediate reaction to reports of Israel striking Iran. Meanwhile, the pullback seen in the US Treasury bond yields helps XAU/USD hold its ground.

Gold News

Bitcoin Weekly Forecast: BTC post-halving rally could be partially priced in Premium

Bitcoin Weekly Forecast: BTC post-halving rally could be partially priced in

Bitcoin price shows no signs of directional bias while it holds above  $60,000. The fourth BTC halving is partially priced in, according to Deutsche Bank’s research. 

Read more

Week ahead – US GDP and BoJ decision on top of next week’s agenda

Week ahead – US GDP and BoJ decision on top of next week’s agenda

US GDP, core PCE and PMIs the next tests for the Dollar. Investors await BoJ for guidance about next rate hike. EU and UK PMIs, as well as Australian CPIs also on tap.

Read more

Majors

Cryptocurrencies

Signatures