The key USDX sign for PMs

Yesterday’s session was indeed volatile around the FOMC, just like we warned, and gold even moved to its previous high, likely forming a double-top pattern. Even though gold moved higher on an intraday basis, it didn’t invalidate its previous breakdown, which was a bearish sign. Gold was likely to decline, and it is declining so far in today’s pre-market trading.
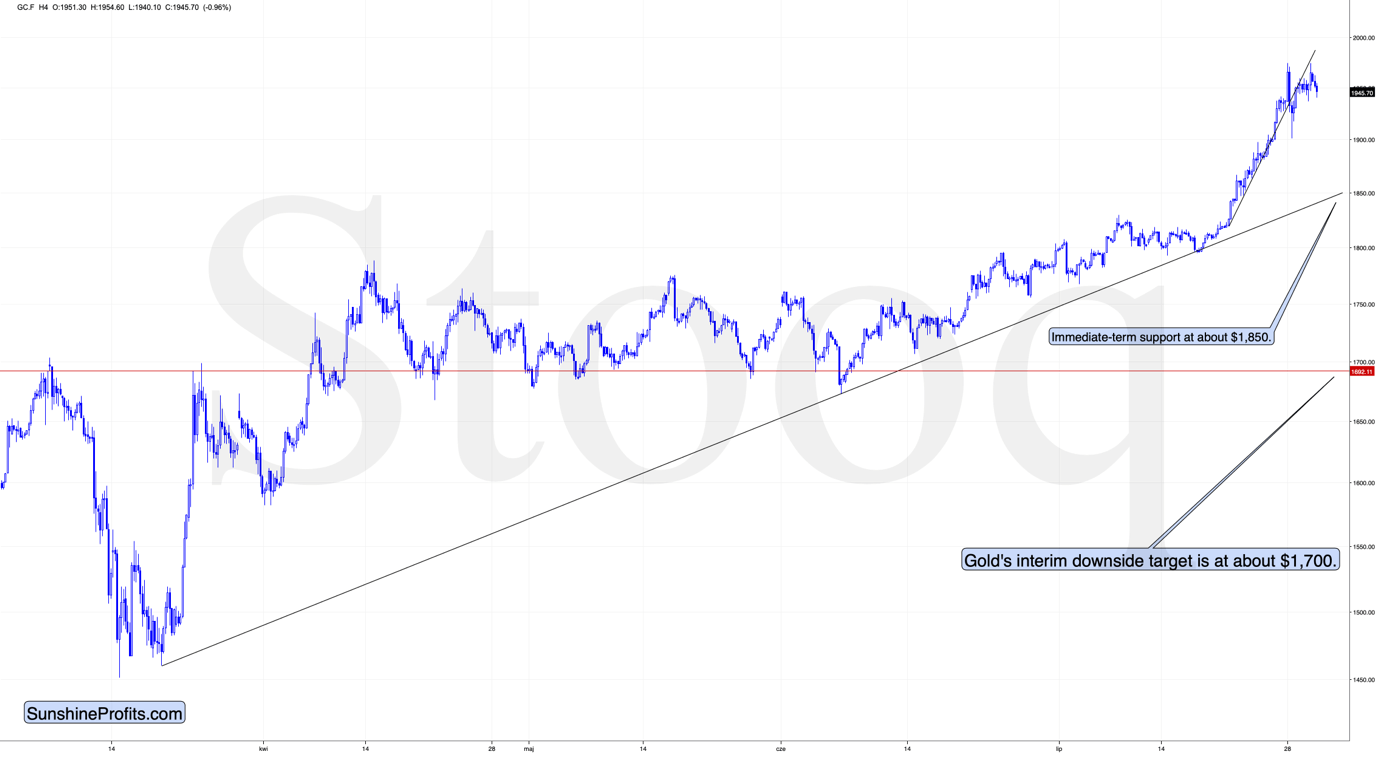
The above chart shows just how precisely yesterday’s upswing ended at the previous support line, verifying it (most likely finally) as resistance. The implications are bearish.
The next short-term support is at about $1,850, but we don’t think that the decline will completely stop there. Instead, after a pause or corrective upswing, a move to about $1,700 – or even lower is likely in the cards. Naturally, this is based on the information that we have available at the moment of writing these words, and the outlook could change in the future.
Why? Because of the confirmations from other markets, including silver and – perhaps most importantly at this time – the USD Index.
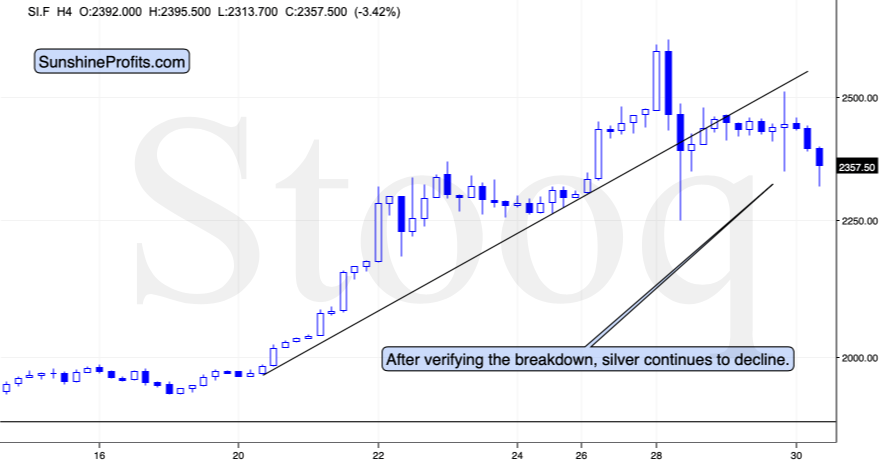
Just like gold, silver moved back to its previous support line and verified it as resistance. It seems that both markets are waiting for USD’s rally (which is likely to arrive shortly) to plunge.
And what did the USD Index do recently?

While gold didn’t move back above its rising support / resistance line, let alone the previous high, the USD Index did move below its previous low.
This means that after a powerful short-term rally, gold is refusing to react to additional bullish indications. This is a strongly bearish sign. Naturally, gold’s verification of its breakdown is bearish as well.
The USD Index itself is also very important, because while the move to new lows is not encouraging, it’s worth keeping in mind that the early March bottom was actually a series of tiny bottoms, when the initial bottom was broken by just a little right before the USD soared.
Consequently, the loss of USD’s bearish momentum might be the thing that one should focus on at the current juncture, and view the breakdown as bearish only if it is confirmed. At the moment of writing these words, the USD Index is already back above its Monday’s intraday low.
At the same time, the USD Index is attempting to move back above its declining short-term resistance line. It seems that this attempt might finally succeed. Let’s keep in mind that breaking above the analogous line in early March was the start of USD’s powerful upswing.
Zooming out shows that there’s a very good reason for the USD Index to rally here.
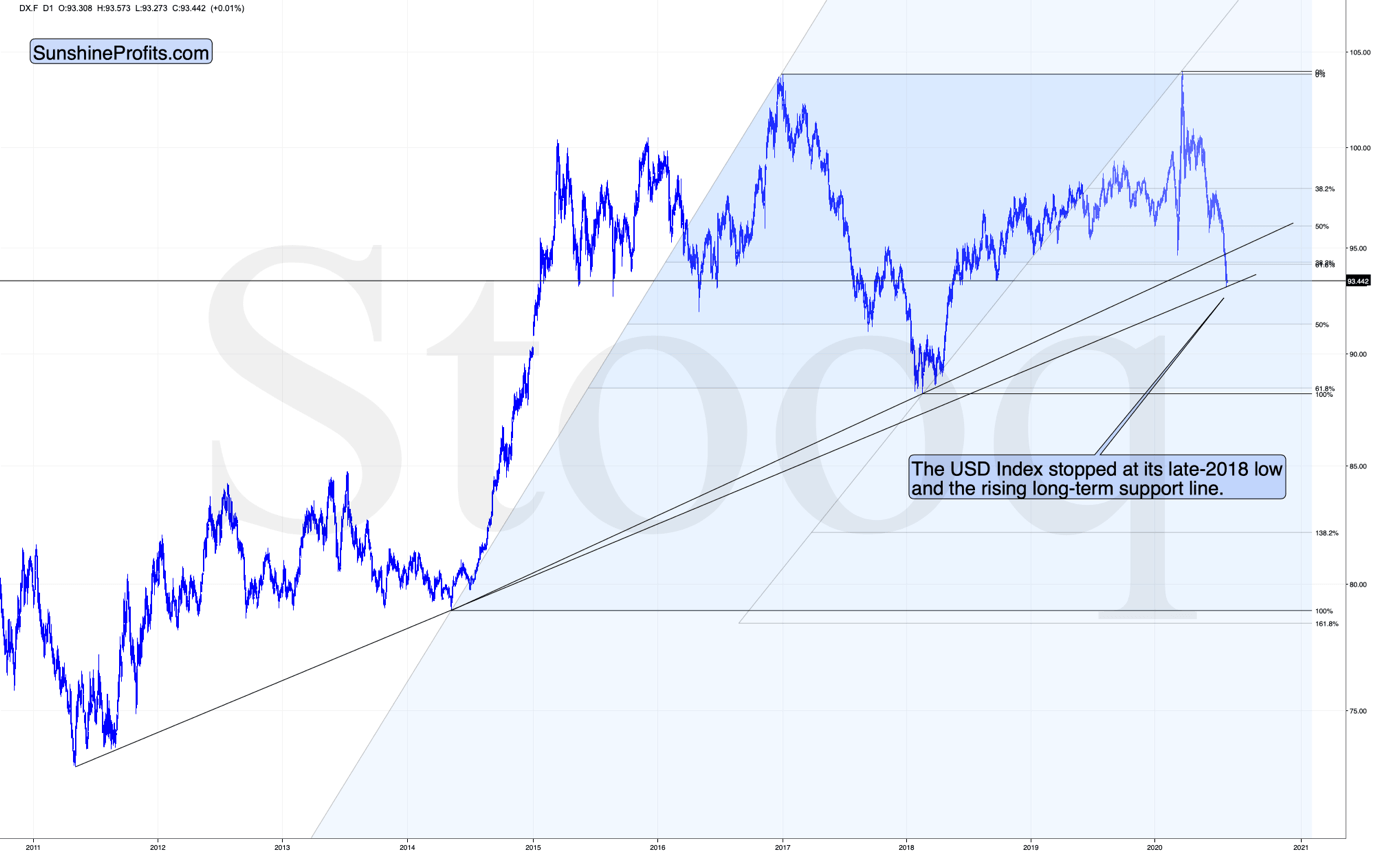
The USD Index just moved to the early-2018 lows, which were also the mid-2015 and 2016 lows (approximately). Additionally, the USDX moved to the rising long-term support line based on the 2011 and 2014 bottoms. And it all happened relatively shortly after the USDX moved below two important Fibonacci retracement levels: 61.8% retracement based on the 2018 – 2020 rally, and the 38.2% retracement based on the 2014 – 2020 rally.
All the above-mentioned factors suggest that the USD Index is going to rally in the very near future. Gold has been magnifying USD’s tiny shows of strength, which suggests that any really visible rally in the USDX is likely to trigger a big sell-off in gold.
And a big sell-off in gold is likely to translate into an even bigger plunge in the gold stocks.
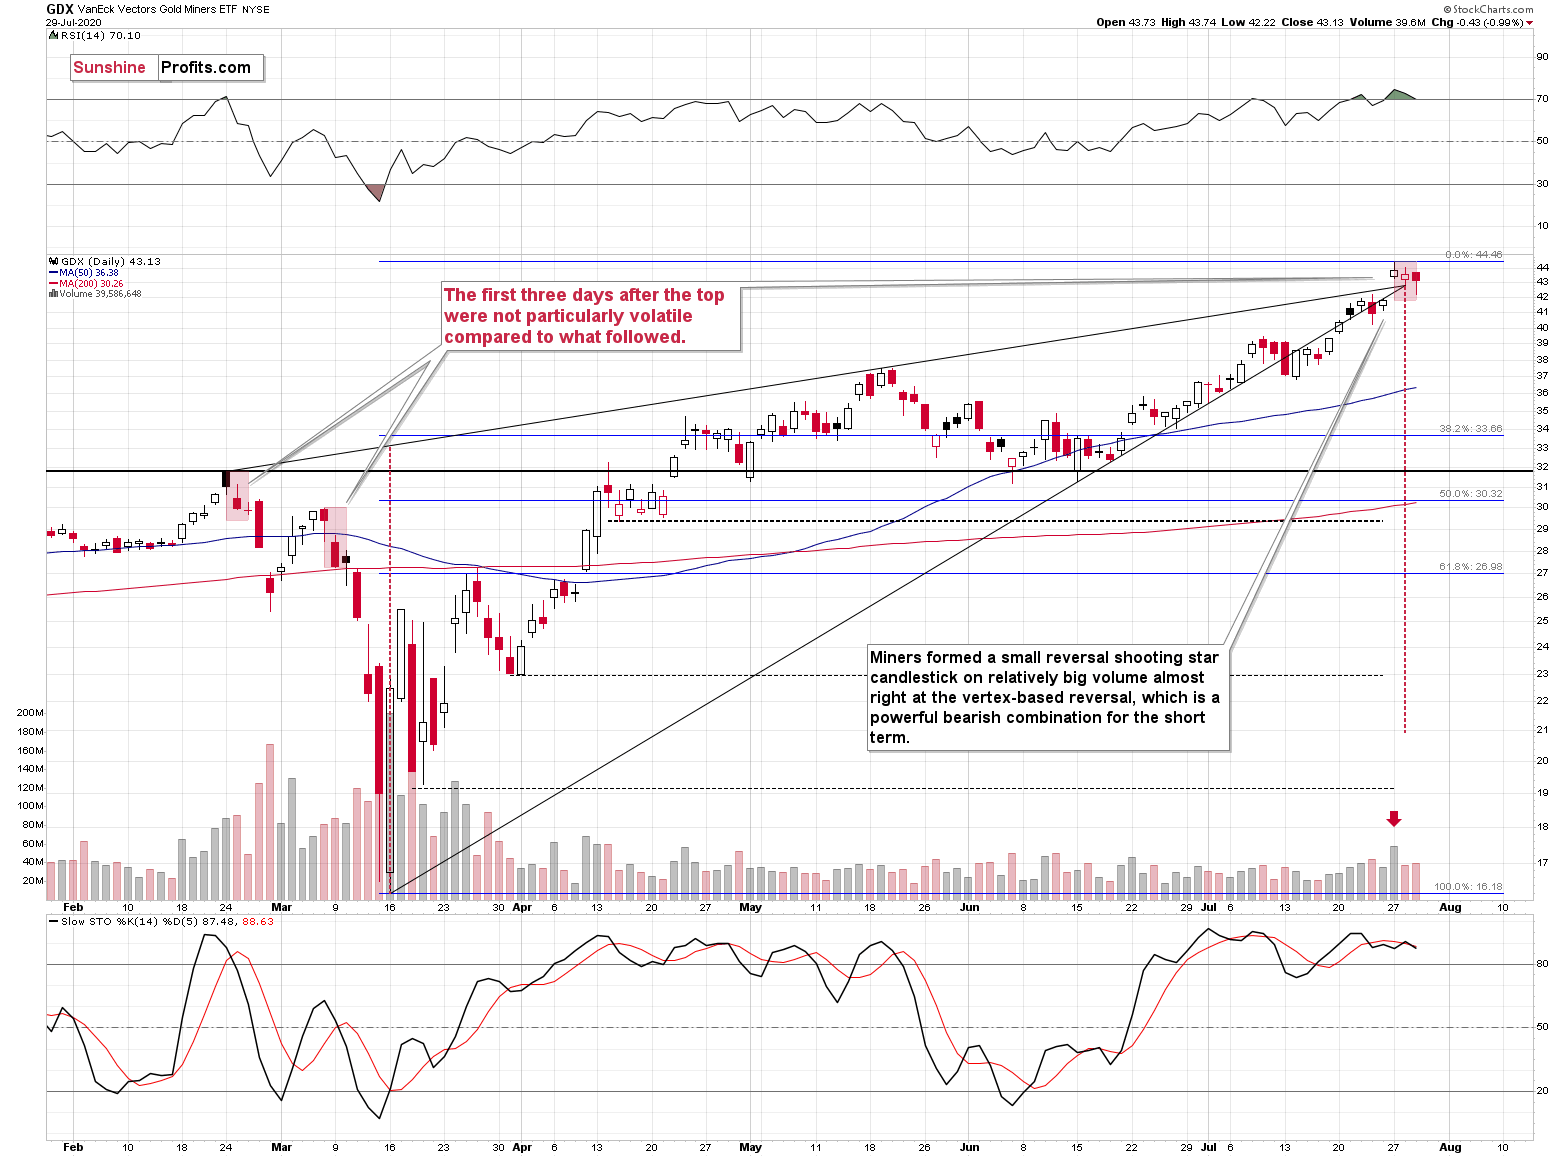
During Monday’s session, miners reversed on big volume and it happened almost right at the vertex-based reversal. Gold stocks then continued to decline on volume that was not minor.
So far, the decline was relatively calm, but let’s keep in mind that the same was the case during the first three trading days of both early-2020 declines. The GDX ETF declined rather insignificantly in late February, and the same was the case in the early March.
The important detail is that while gold moved to the precious high during yesterday’s session, gold miners didn’t. Their underperformance relative to gold along with the RSI above 70, and the recent reversal make the outlook very bearish for gold and silver mining stocks.
Summing up, it seems that gold has formed a double-top pattern, just as the USD Index seems to have finally bottomed. Gold and silver have both reacted very strongly to the USDX developments, which has very bearish implications for the following days. The verifications of the very short-term breakdowns in gold and silver serve as bearish confirmations.
The miners have reversed this week on strong volume and practically right at the vertex-based reversal, and it all happened after they had flashed the extremely overbought signal through the Gold Miners Bullish Percent Index.
The implications are very bearish for the next several days – weeks.
Want free follow-ups to the above article and details not available to 99%+ investors? Sign up to our free newsletter today!
Want free follow-ups to the above article and details not available to 99%+ investors? Sign up to our free newsletter today!
Author

Przemyslaw Radomski, CFA
Sunshine Profits
Przemyslaw Radomski, CFA (PR) is a precious metals investor and analyst who takes advantage of the emotionality on the markets, and invites you to do the same. His company, Sunshine Profits, publishes analytical software that any


