The Harmonic Behavior of Tesla

Chaos Clinic for 1/17/2020
Nearly ten years ago, my attention was attracted to the news of an IPO for a Tesla Motors. As an engineer I am a great fan of the man who invented the AC power system now used world wide - in his head, as a 17 year old youth wandering through the forests of Bavaria. I figured anyone who was using Tesla's name had a lot to live up to.
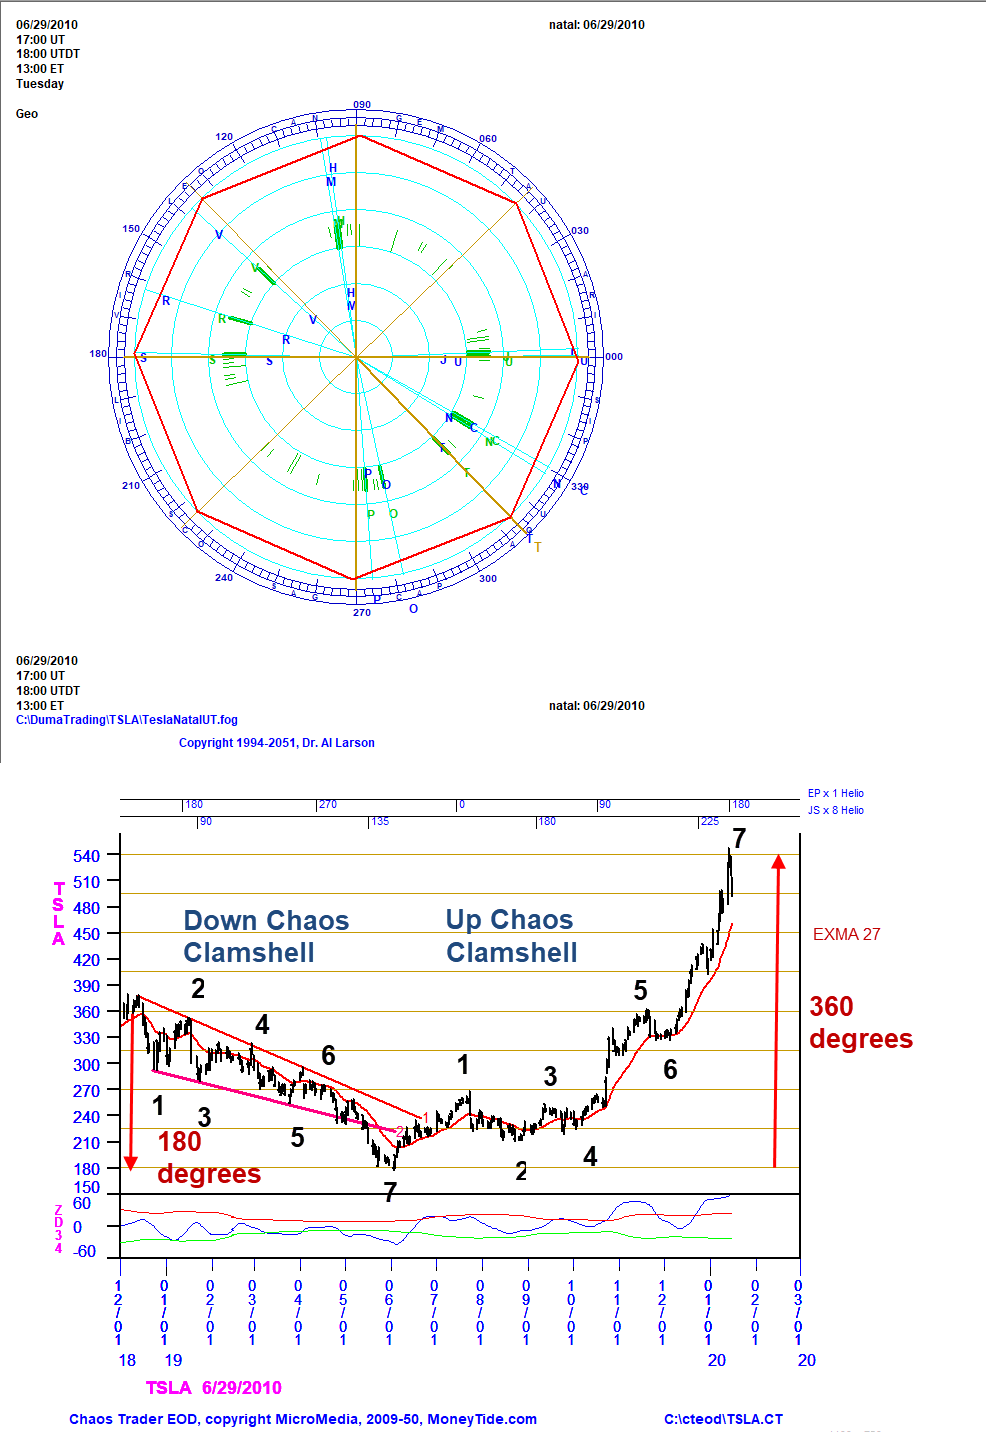
So the first thing I did was to look at the first trade chart for TSLA. It is shown in the top chart above. TSLA has a very clear and strong octagon. On the horizontal axis Jupiter opposes Saturn, Gann's 20 year Master Cycle. Aligned with them is Uranus, ruler of things electric.
Very near the top of the circle are Sun and Venus, opposing Pluto. Venus and the Moon set up a 45 degree axis between 135 degrees and 315 degrees. This makes the 8th harmonic very strong is TSLA. The slight offset of Sun. Mercury oppose Pluto from vertical creates a high frequency instability, which can lead to fast moves at times.
TSLA is tightly coupled to the Earth's seasons, with Jupiter and Uranus on the Spring Equinox, Sun and Mercury near the Summer Solstice, Saturn on the Fall Equinox, and Pluto near the Winter Solstice.
So my expectation was that TSLA prices would have a strong tendency to make turns at $45 dollar increments, assuming a Wheel of 360 scaling of degrees to price. I also expected it to be a volatile stock.
History has proven that to be true. The second chart shows an example covering 15 months, from 12/1/2018 to present. Prices start the chart near 360. From there prices dropped a harmonic 180 degrees in 6 months, in a 7 move down Chaos Clamshell, From there prices bounced up into a 1-2-3-4 basing pattern,near the 225 degree level. Then last October, prices headed higher, They broke the 270 degtree level, and quickly reached the 360 level at point 5.
After a brief sag in December, prices really began to move up, helped by good economic news and a lot of hype for TSLA. In less than two months, prices shot up to 540. From the base of 180, that is a full circle move. That is clearly harmonic behavior, as suggested by the first trade chart.
Along the top of the chart are two astro cycles.Interestingly, the blow off move came as Earth opposed Pluto,
the two planets at the top of the first trade wheel.
The subgraph at the bottom of the chart is a 34 day Zero Delay filter oscillator, which helps one see the moves in the Chaos Clamshell.
TSLA has been a volatile stock, helped in part by the erratic behavior of founder Elon Musk. But no matter what the economic prosects, TSLA will always be a harmonic stock, Significant turning points will found at the harmonic points of the circle. Multiples of 360 are most important, then 180, then 90, and finally 45..
This content was published on Dr. Al Larson's Chaos Clinic which you can attend each Friday for free.
Dr. Al Larson has developed a complete Chaos Model of Markets, four unique courses that let you become a Certified Chaos Trader, some very unique eMylar fractal pattern overlays, and tools that permit forecasting individual stocks and markets years in advance. You can also sign up for a free weekly email, and attend a free Chaos Clinic on Fridays. To learn more, click on the author's profile.
Be sure to sign up for the free weekly email!
Author

Dr. Al Larson, PhD
MoneyTide.com
Dr. Al Larson holds a Ph.D. in Electrical and Computer Engineering from the University of Wisconsin. He is a 1964 Distinguished Graduate of the U. S. Air Force Academy.


