The golden cycle: Insights into Gold's long-term trends and near-term potential

Gold (XAU/USD) has had a rich and intricate long-term price cycle since 1998. This history reveals a sustained trajectory marked by significant price movements, and the current cycle suggests the possibility of an impending pullback. As a traditional safe haven asset, gold's importance often comes to the forefront during periods of global financial uncertainty and geopolitical tensions.
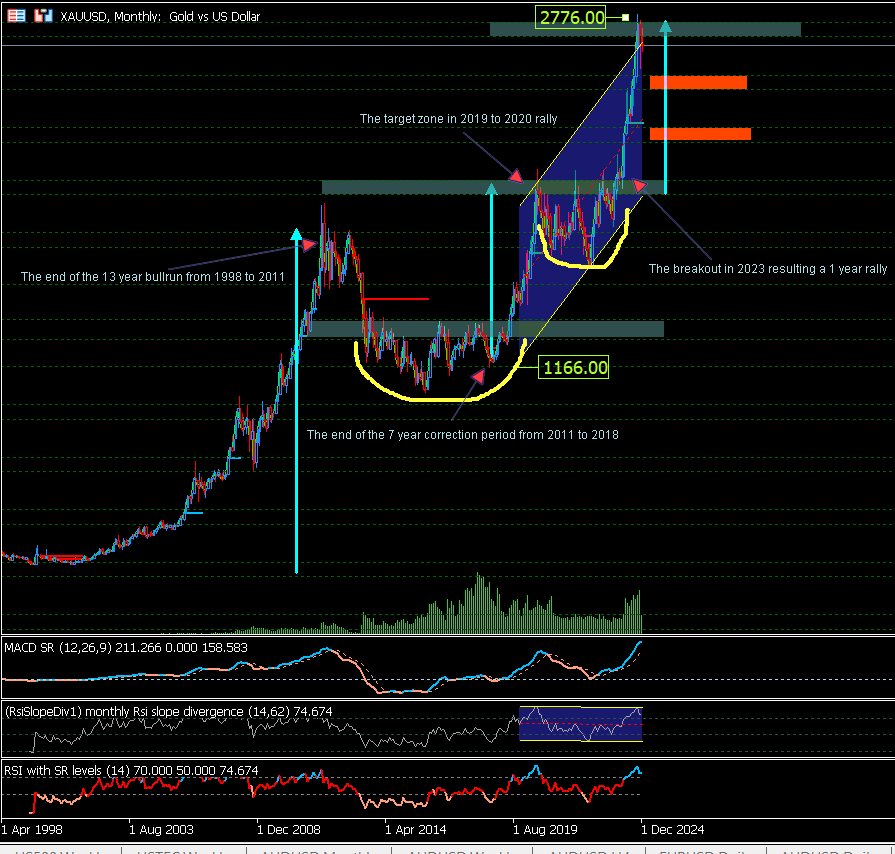
The Bull run that started in 1998 was characterized by a remarkable and uninterrupted ascent in gold prices, which persisted for an impressive 13 years. This bullish phase came to a halt in 2011 when the market entered a correction phase—a period marked by a temporary decline in prices that lasted for about eight years. During this correction, various factors, including macroeconomic conditions, shifts in investor sentiment, and varying supply and demand dynamics, shaped the landscape of the gold market.
However, gold began to reclaim its upward momentum in 2019, marking the start of a new rally that propelled it to a crucial price zone at 2776. A wealth of analytical data has been generated within this bullish trend, allowing traders and analysts to form and examine intricate price structures and patterns that inform their strategic decisions. In addition, gold's status as a safe haven has been particularly pronounced in the context of ongoing geopolitical turmoil, such as the conflict in Ukraine and Russia and tensions in the Middle East. These global crises have amplified the demand for gold as investors seek to protect their portfolios from potential economic fallout.
A comprehensive analysis of price patterns in relation to market behaviour is essential. By utilizing supply and demand analysis across multiple time frames and key tools such as volume profiles, traders can enhance their ability to identify potential market cycles and forthcoming corrections. It's important to emphasize that major shifts in financial markets typically originate from smaller price movements, and recognizing these crucial price movements empowers traders to anticipate potential scenarios, whether minor pullbacks or more significant corrections.
The price breakouts observed in 2019 and 2023 have shared striking similarities in their patterns, indicating that the one-year Bull run, which commenced in November 2023, may soon be approaching a pullback. Moreover, the formation of the Cup and Handle price pattern—a widely recognized bullish continuation pattern—has been in progress from 2011 to 2023. This pattern is crucial for identifying buying opportunities, and given its recent completion, it suggests a heightened likelihood of a pullback before an upward momentum in the near term.
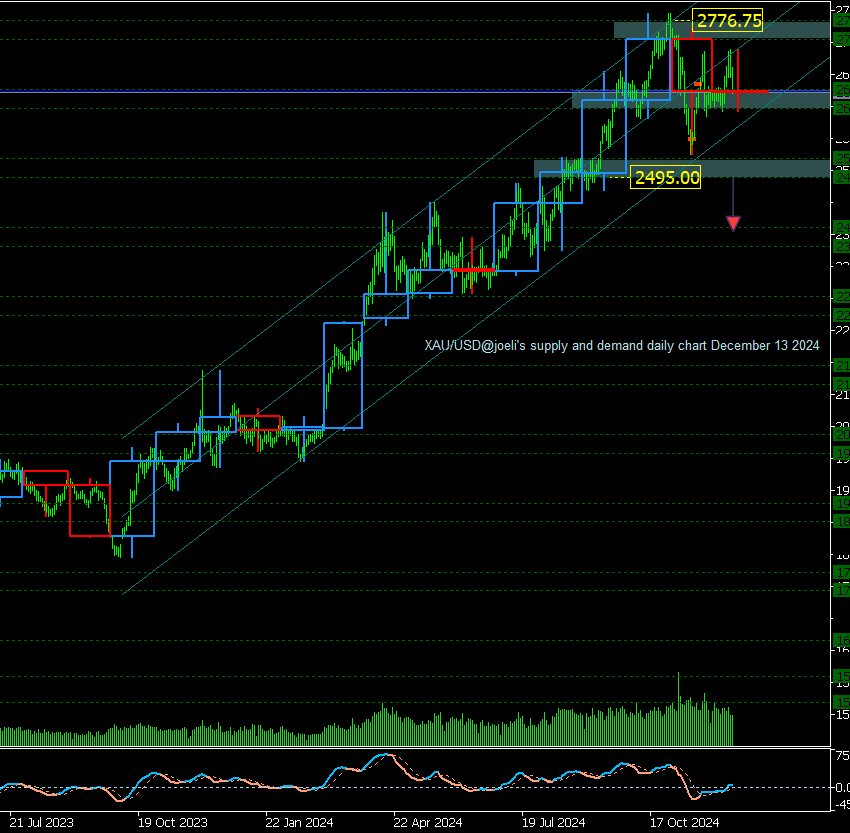
Should gold's price dip and establish a foothold around the vital 2495 support zone, this could present a compelling buying opportunity for bullish traders eager to capitalize on a potential continuation of the upward trend. This scenario offers a glimmer of hope for profit as market sentiment shifts, especially as investors increasingly turn to gold in light of ongoing international conflicts and market volatility. Conversely, if the price decisively falls below this significant support level, it may herald a deeper decline, with the next potential target being around the 2000 price zone.
For traders and investors, it's imperative to maintain a keen focus on both long-term and short-term trends, as these aggregate movements provide crucial insights into market direction. Understanding the interplay between past patterns and prospective price movements is key to navigating the complex and dynamic world of gold trading, ultimately influencing strategic investment decisions in this valuable asset class. The ongoing demand for gold as a safe haven amid global challenges underscores its role as a critical asset during times of uncertainty, further solidifying its status on the world stage.
Gold monthly chart with price patterns and projected targets
Gold's combined daily and Monthly chart highlights the one-year bull run with the drop from the 2776 zone and the crucial 2495 support zone
Author

Denis Joeli Fatiaki
Independent Analyst
Denis Joeli Fatiaki possesses over a decade of extensive experience as a multi-asset trader and Market Strategist.


