The Gold Market in 2016

How can we summarize the last year in the gold market? First of all, it was a mixed year for gold. The first half of 2016 was excellent for the yellow metal. Actually, the several-month long bull market in gold started in December 2015, when the shiny metal found a bottom at $1,049, after the FOMC historical meeting and the first interest rate hike for almost a decade. From then, the shiny metal made higher highs and higher lows, reaching a peak at $1,366 at the early July in the aftermath of the British referendum on the withdrawal from the EU. Gold was one of the best performing assets that time, and gained about 30 percent, as one can see in the chart below.
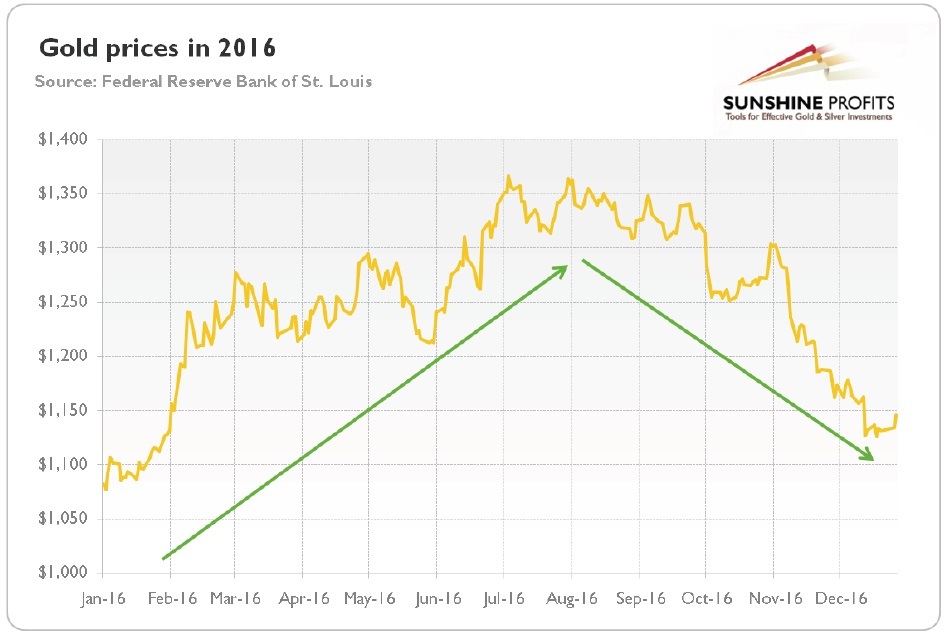
With the gloomy outlook after the Brexit vote and the uncertainty about the outcome of the U.S. presidential election, the future of gold was supposed to be rosy. However, nothing could be further from the truth. Since then, the shiny metal has been making lower highs and lower lows, with the one short-lived rally on election night. In December 2016, the price of gold dropped below $1,150, not a very distant level from the beginning of the year. Anyway, the yellow metal managed to gain about 8 percent in 2016. It is definitely an important improvement compared to previous bearish years (by the way, in the previous annual summary and outlook, we correctly predicted that 2016 will be better for gold than 2015), but gold's performance fell short of expectations based on the fundamental data. What is especially striking is that gold prices did not rally despite many potential catalysts, such as the Brexit vote, the Trump victory, the terrorists attacks in Europe, the geopolitical tensions in the Middle East, or the defeat of Italy's constitutional referendum.
Interestingly, the price of gold expressed in Euros and British pounds showed a similar development to the U.S. dollar-denominated price, as one can see in the chart below. However, on a relative basis, the price of gold gained much more in these two currencies (especially in British pounds, which shows that gold prices actually responded to the Brexit vote), confirming the impact of the greenback's value on the price of gold.

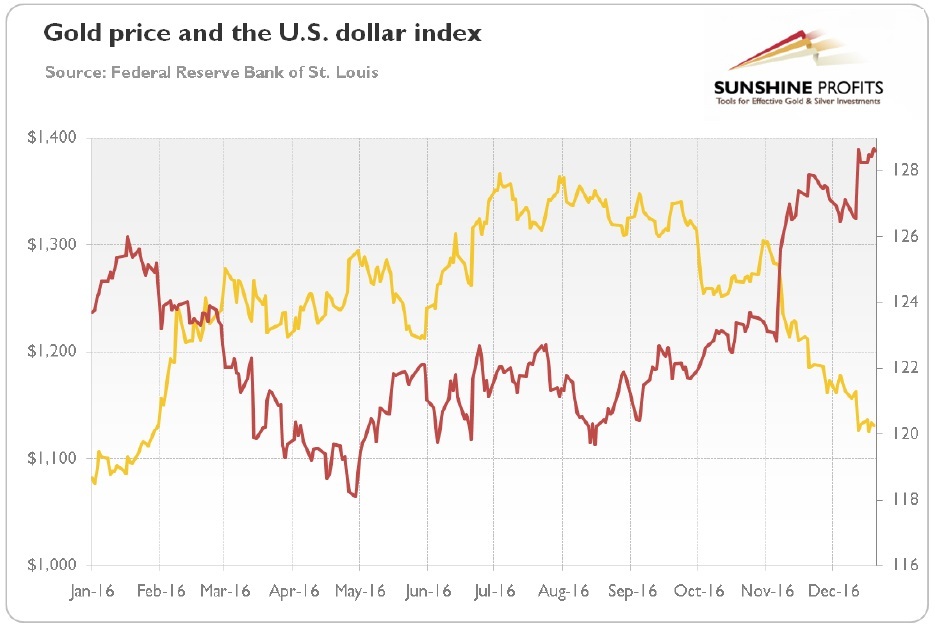
Indeed, the U.S. dollar was one of the main drivers of the gold prices in the last year, as the next chart shows. Actually, the price of gold looks like a mirror reflection of the greenback's value. Gold prices rallied in the first quarter of 2016, while the U.S. dollar declined due to stock market turmoil and concerns about the global economy. Then, this trend reversed in May, when the surprisingly hawkish minutes of the Fed's April meeting were released. However, the decline in gold prices did not last long, as the shockingly weak May payrolls and the following dovish Yellen's comments weakened the greenback and increased the safehaven demand for gold. In the third quarter of 2016, the U.S. dollar was trading sideways and gold ran out of steam. But since September, the Fed started telegraphing high chances of a rate hike in December, which sent gold prices south in October. And the post-election rally in the greenback sent a killing blow to the yellow metal.
As usual, the real interest rates also played a significant role in driving the price of gold. Actually, the negative correlation is even stronger here than in the case of the yellow metal and greenback (as both these assets were rising after the Brexit vote). The mirror-image symmetry between the price of gold and real interest rates confirms that the shiny metal is a monetary asset strongly affected by the Fed's actions and U.S. macroeconomic situation in the medium and long run. It was perhaps the best seen in the aftermath of the Trump's victory, when real interest rates rose due to expectations of fiscal stimulus and accelerated real economic growth.

To sum up, the price of gold rose by 8 percent in 2016. Although it performed better than last year, all gains were made in the first half of the year. Indeed, gold was one of the best investments in the H1 2016, and one of the worst in the second half of the year. The stronger U.S. dollar and rising real interest rates caused gold prices to fall like a stone in the fourth quarter of the year. It means that the bull market of 2016 has turned bearish, as market sentiment and macroeconomic conditions changed in the aftermath of the U.S. presidential election. Hence, gold investors should focus on the above-mentioned factors, not on the geopolitics, gold reserves and annual balance between demand and supply. Will the bear market continue in 2017? It depends on the U.S. central bank actions and market sentiment toward Trump's policies. If investors believe in stronger real economic growth and a more hawkish Fed, the greenback may strengthen, while the price of gold will decline further. On the other hand, if investors believe that Trump's will not accelerate growth but only inflation, while the Fed turns out even more dovish, the price of gold could catch its breath.
If you enjoyed the above analysis and would you like to know more about the most important factors influencing the price of gold, we invite you to read the January Market Overview report. If you're interested in the detailed price analysis and price projections with targets, we invite you to sign up for our Gold & Silver Trading Alerts. If you're not ready to subscribe at this time, we invite you to sign up for our gold newsletter and stay up-to-date with our latest free articles. It's free and you can unsubscribe anytime.
Want free follow-ups to the above article and details not available to 99%+ investors? Sign up to our free newsletter today!
Author

Arkadiusz Sieroń
Sunshine Profits
Arkadiusz Sieroń received his Ph.D. in economics in 2016 (his doctoral thesis was about Cantillon effects), and has been an assistant professor at the Institute of Economic Sciences at the University of Wrocław since 2017.


