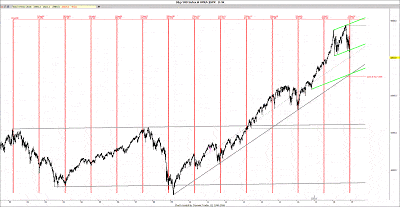
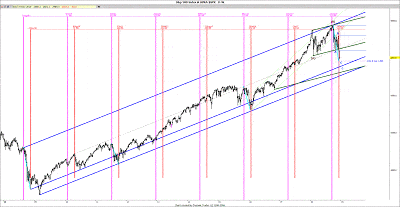
The Flash Crash cycle is in progress right now

NDX is at long term channel support, a break below could trigger the Flash Crash cycle wave due in December 2018
I have written extensively about my discovery of the Flash Crash (FC) cycle in past posts
I first mentioned the Flash Crash cycle back in May 2010, when the Flash Crash happened and I discovered then there was a regular Flash Crash cycle, which is a Gann 360 TD/525 Calender day/75 week crash cycle.
On September 2011 for example, the FC cycle was predicting an October 2011 FC Low
Actual: We saw an 10/4/11 major Low
The Flash Crash 525 CD cycle
04/14/00L - 09/21/01L = 525 CD = 75 weeks = 2.618 X 200 CD = 523.6
04/14/00L - 03/12/03L = 1062 CD = 2.02 X 525 CD = 03/12/03 Major Low
04/14/00L - 08/13/04L = 1582 CD = 3.01 X 525 CD = 08/13/04 Major Low
04/14/00L - 11/21/08L = 3143 CD = 5.99 X 525 CD = 11/21/08 Major Low,
04/14/00L - 05/06/10L = 3674 CD = 7.00 X 525 CD = 05/06/10 flash Crash,
04/14/00L - 10/14/11L = 4200 CD = 7.98 X 525 CD = 10/04/11L, Major Low.
The Flash Crash 75 week cycle
7 out of 9 FC Cycles saw 7%-26% (avg 12-14%) declines and most are in 2-3 wks
03/24/00H - 04/14/00L was a 14% decline in 3 weeks
08/31/01H - 09/21/01L was a 20% decline in 3 weeks
01/31/13H - 03/12/03L was a 16% decline in 8 weeks
06/24/04H - 08/13/04L was a 7% decline in 7 weeks
11/04/08H - 11/21/08L was a 26% decline in 3 weeks
04/26/10H - 05/06/10L was a 12% decline in 3 weeks
09/16/11H - 10/04/11L was a 12% decline in 2 weeks
Conclusion: The 360 TD Flash Crash Cycle predicted many crashes and major Lows in the past, including the 4/14/00 crash Low, 9/21/01 crash Low, 3/12/13 Low, 8/13/04 Low, 11/21/08 crash Low, 5/6/10 FC, 10/04/11 crash Low, 1/20/16 Crash Low and now again in December 2018 Lows. Some were misses, but in general, it is a regular cycle to be reckoned with.The Flash crash (FC) cycle, once active sees an average 12-14% decline in a few weeks. As the Flash Crash (FC) Cycle is a 1 1/2 year fixed cycle, it will have a +/- variance of a few weeks, so timing the exact Low will be Key as once the Flash Crash cycle bottoms, we will see a sharp rally afterwards.
Author

Raj Ian G Thijm, MBA
Raj Time and Cycles
I have been actively involved in the Financial Markets since August 1987. After receiving my B.S.