Silver retreats from record high as investors lock in profits

Silver prices dropped more than 3% on Friday after reaching an all-time high earlier in the session, as investors booked profits, while gold slipped back from a seven-week peak.
Spot silver declined around 3% to $61.89 per ounce by 13:40 p.m. ET (18:40 GMT), after touching a record $64.66 earlier.
Silver prices are up nearly 5% for the week and have risen 112% so far this year, driven by shrinking inventories, steady industrial demand, and its addition to the U.S. critical minerals list.
The U.S. Federal Reserve this week delivered its third and final quarter-point rate cut of the year but signaled it would be cautious about any further easing until more data becomes available.
Markets are now pricing in two rate cuts for next year, with investors looking ahead to next week’s U.S. non-farm payrolls report.
U.S. stocks declined on Friday, pushing the S&P 500 and Nasdaq to their lowest levels in more than two weeks, as Treasury yields climbed following hawkish comments from several policymakers, while Broadcom’s latest results fueled worries about a potential AI-driven bubble.
CME FedWatch:
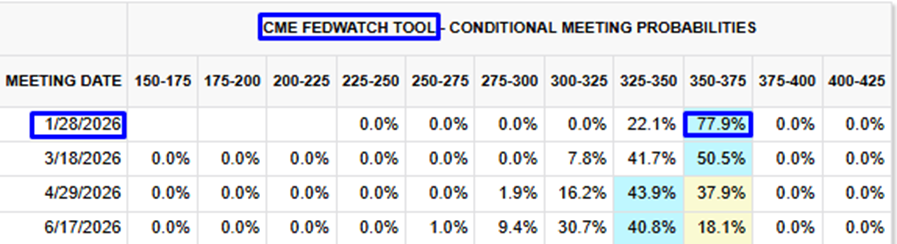
· CME FedWatch January rate cut probabilities are 77.90%.
· January rate easing probabilities are at 50.5%.
Technical Analysis Perspective:
Silver / US Dollar:
· Spot silver broke below its rising channel after hitting a new all-time high today.
· The sell-off is very strong and will likely extend into early next week.
· Prices appear to be heading toward a test of $59.40, the previous record high.
· From a technical perspective, a retest of the prior all-time high is a healthy development for the continuation of the uptrend.
· However, a sustained and sharp move below $59.40 could deepen the correction toward the $57.75–$57.25 area.
Silver Daily chart:
SLV (SPDR Silver trust) ETF:
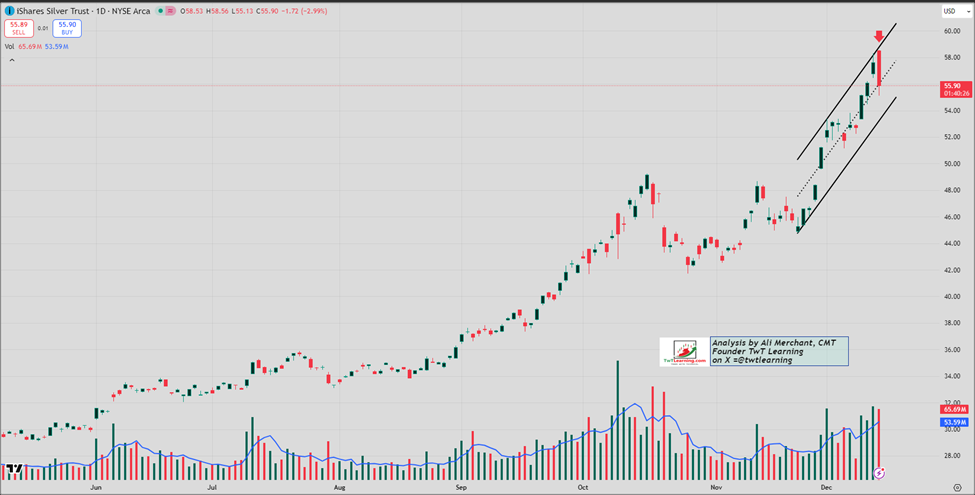
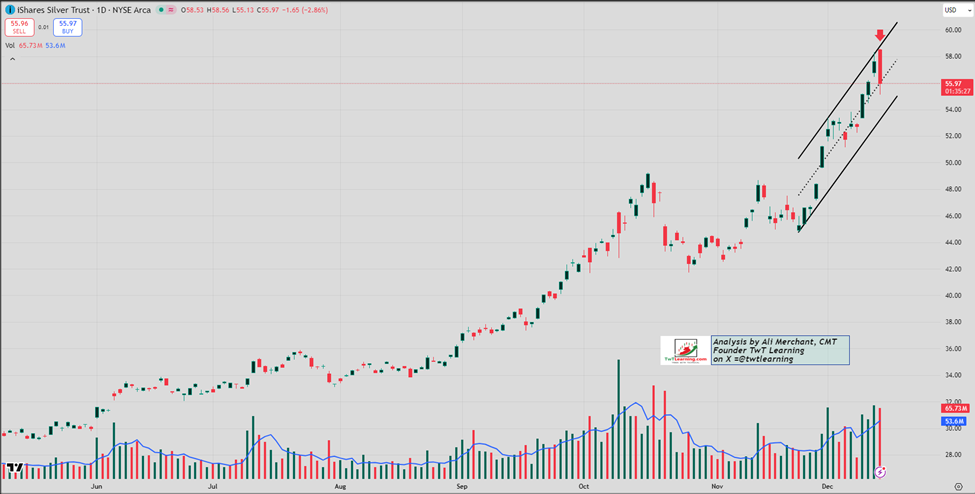
· SLV has been trading within an ascending channel since November 21, 2025.
· Prices rejected the channel’s upper boundary near 58.60, which is now acting as strong resistance.
· The ETF is hovering around the 56 level; a close below this area would point to further downside toward 53.75–53.40 early next week.
· Conversely, a daily close above 56 would likely trigger a corrective rebound toward 56.90 and 57.40.
SLV daily chart:
SLV seasonality:
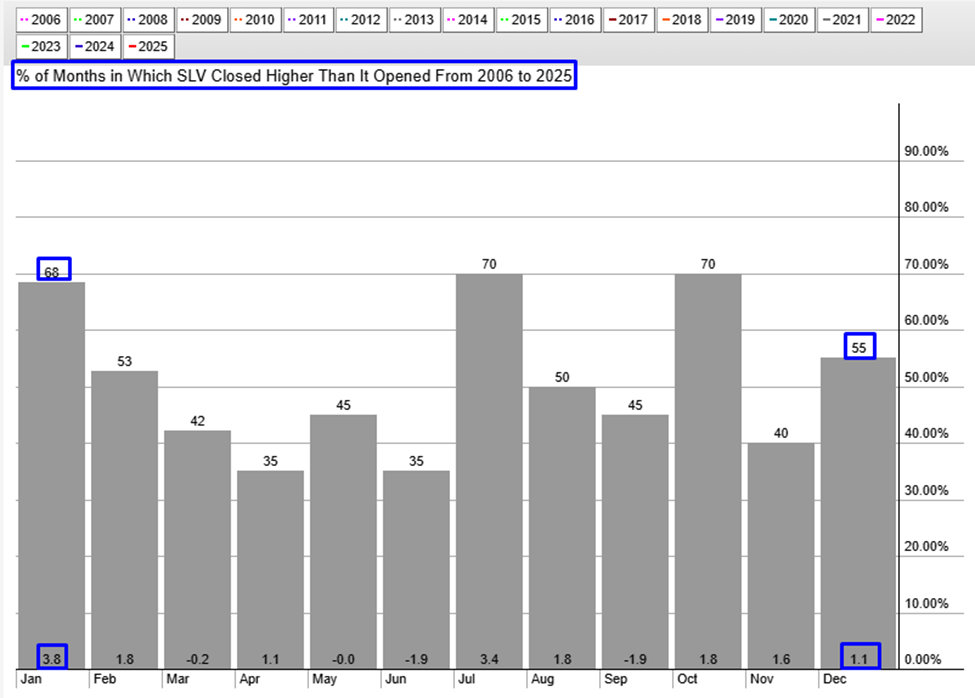
Since 2006, SLV has gained an average of 1.1% in December in 55% of those years, while January has delivered an average rise of 3.8% in 68% of the years.
Author

Ali Merchant, CMT
TwT Learning
Ali Merchant is a seasoned financial market professional with expertise in Technical Analysis, Treasury & Capital Markets, Trading, Sales, Research, Training, & Fund Management, He has been trading FX, FX options, US stocks & opti