The Bulls Take a Break

US Dollar: June USD is Down at 97.790.
Energies: June '19 Crude is Up at 63.15.
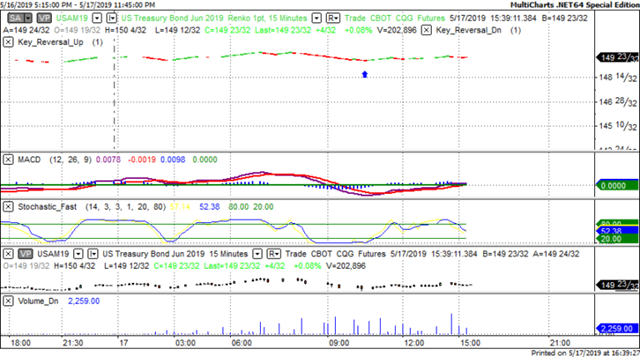
Financials: The Jun 30 year bond is Down 4 ticks and trading at 149.18.
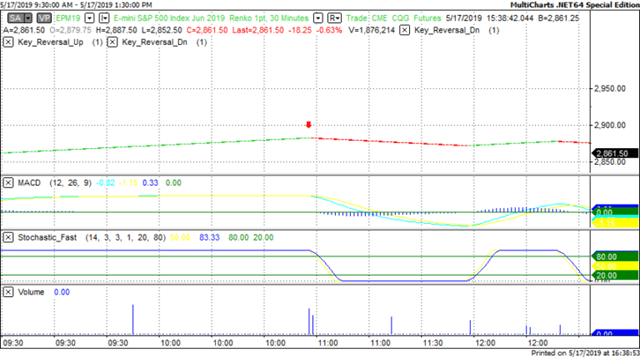
Indices: The June S&P 500 emini ES contract is 18 ticks Lower and trading at 2857.50.
Gold: The June Gold contract is trading Down at 1274.80. Gold is 9 ticks Lower than its close.
Initial Conclusion
This is not a correlated market. The dollar is Down- and Crude is Up+ which is normal and the 30 year Bond is trading Lower. The Financials should always correlate with the US dollar such that if the dollar is lower then bonds should follow and vice-versa. The S&P is Lower and Crude is trading Higher which is correlated. Gold is trading Lower which is not correlated with the US dollar trading Down. I tend to believe that Gold has an inverse relationship with the US Dollar as when the US Dollar is down, Gold tends to rise in value and vice-versa. Think of it as a seesaw, when one is up the other should be down. I point this out to you to make you aware that when we don't have a correlated market, it means something is wrong. As traders you need to be aware of this and proceed with your eyes wide open.
Asia is trading Mixed with half the exchanges trading Higher and the other half Lower. Currently all of Europe is trading to the Downside.
Possible Challenges To Traders Today
-
FOMC Member Clarida Speaks at 1 PM EST. This is major.
-
Lack of major economic news.
Treasuries
We've elected to switch gears a bit and show correlation between the 30 year bond (ZB) and The YM futures contract. The YM contract is the DJIA and the purpose is to show reverse correlation between the two instruments. Remember it's liken to a seesaw, when up goes up the other should go down and vice versa.
On Friday the ZB made a major move at around 10 AM EST. The ZB hit a Low at around that time and the YM hit a High. If you look at the charts below ZB gave a signal at around 10 AM EST and the YM was moving Lower at the same time. Look at the charts below and you'll see a pattern for both assets. ZB hit a Low at around 10 AM and the YM was moving Lower at the same time. These charts represent the newest version of MultiCharts and I've changed the timeframe to a 15 minute chart to display better. This represented a Long opportunity on the 30 year bond, as a trader you could have netted about 10 ticks per contract on this trade. Each tick is worth $31.25. Please note: the front month for the ZB contract is now June, 2019 and I've changed the format to Renko bars such that it may be more apparent and visible.
Charts Courtesy of MultiCharts built on an AMP platform.
Bias
On Friday we gave the markets a Downside bias and the markets didn't disappoint. The Dow dropped 99 points and the other indices lost ground as well. Today we aren't dealing with a correlated market and our bias is to the Upside. Today we aren't dealing with a correlated market and our bias is Neutral.
Could this change? Of Course. Remember anything can happen in a volatile market.
Commentary
It appeared as though the rules of Market Correlation will ring true regardless of geopolitical events. On Friday we predicted a downside day as our rules of Market Correlation told us so and the markets didn't disappoint. Today our bias is to the Upside and of course time will tell if this is correct. But the bigger picture is this: the market wants to return to parity as to where it was prior to the Trade Wars erupting. What is happening is that it is slowly approaching that parity but is doing so in a steady cautious manner. In other words, the markets gain ground and then fall back, gains ground and then falls back. You might be asking "but why is this" It is because traders and the Smart Money wants to take capital off the table and then advance. There's an old saying on Wall Street: no one ever went broke taking money off the table. Same analogy applies....
Author

Nick Mastrandrea
Market Tea Leaves


