The Bears Strike Again

Good Morning Traders,
As of this writing 4 AM EST, here’s what we see:
US Dollar: Jun. USD is Down at 99.500.
Energies: May Crude is Up at 51.10.
Financials: The June 30 year bond is Up 5 ticks and trading at 154.19.
Indices: The June S&P 500 emini ES contract is 20 ticks Higher and trading at 2338.75.
Gold: The April gold contract is trading Down at 1280.70. Gold is 27 ticks Lower than its close.
Initial Conclusion
This is a nearly correlated market. The dollar is Down- and crude is Up+ which is normal and the 30 year bond is trading Lower. The Financials should always correlate with the US dollar such that if the dollar is lower then bonds should follow and vice-versa. The indices are Up+ and Crude is trading Up+ which is not correlated. Gold is trading Down- which is not correlated with the US dollar trading Down-. I tend to believe that Gold has an inverse relationship with the US Dollar as when the US Dollar is down, Gold tends to rise in value and vice-versa. Think of it as a seesaw, when one is up the other should be down. I point this out to you to make you aware that when we don’t have a correlated market, it means something is wrong. As traders you need to be aware of this and proceed with your eyes wide open.
At this hour Asia is trading mainly Higher with the exception of the Nikkei exchange which is trading fractionally Lower. As of this writing Europe is trading mixed with half the exchanges higher and the other half lower.
Possible Challenges To Traders Today
– Philly Fed Mfg Index is out at 8:30 AM EST. This is major.
– Unemployment Claims is out at 8:30 AM EST. This is major.
– CB Leading Index m/m is out at 10 AM EST. This is major.
– Nat Gas Storage is out at 10:30 AM EST. This is major.
– Treasury Sec Mnuchin Speaks at 1:15 PM EST. This is major.
Treasuries
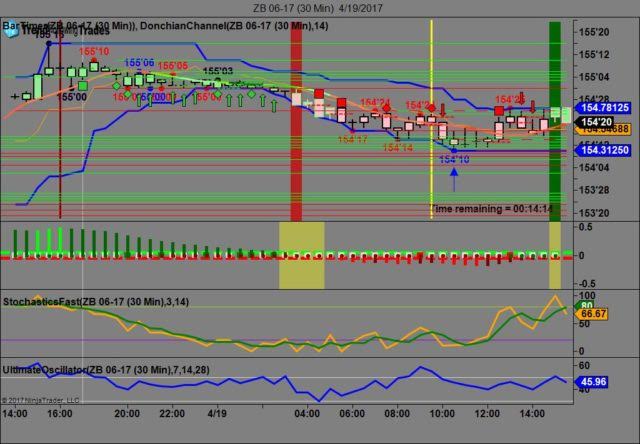
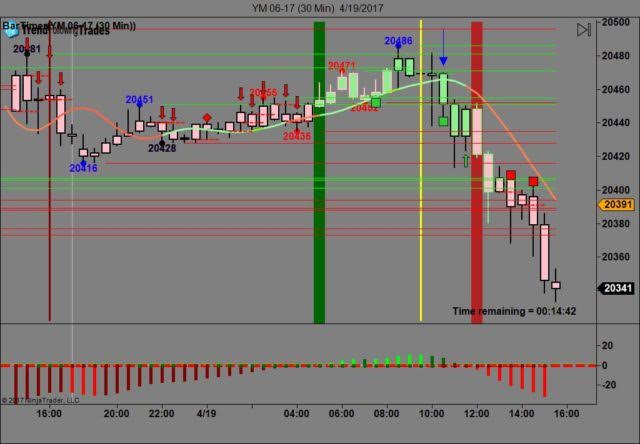
We’ve elected to switch gears a bit and show correlation between the 30 year bond (ZB) and The YM futures contract. The YM contract is the DJIA and the purpose is to show reverse correlation between the two instruments. Remember it’s liken to a seesaw, when up goes up the other should go down and vice versa.
Yesterday the ZB made it’s move at around 10:30 AM at around the time that crude inventory was reported. The ZB hit a low at around that time and the YM hit a high. If you look at the charts below ZB gave a signal at around 10:30 AM and the YM was moving lower at the same time. Look at the charts below and you’ll see a pattern for both assets. ZB hit a low at around 10:30 AM and the YM hit a high. These charts represent the newest version of Trend Following Trades and I’ve changed the timeframe to a 30 minute chart to display better. This represented a long opportunity on the 30 year bond, as a trader you could have netted about 15 plus ticks per contract on this trade. Each tick is worth $31.25. We added a Donchian Channel to the charts to show the signals more clearly.
Charts Courtesy of Trend Following Trades built on a NinjaTrader platform.
Bias
Yesterday we gave the markets an upside bias as both the Bonds and Gold were trading lower yesterday morning and usually this results in an upside day. The markets however had other ideas as the Dow dropped 119 points, the S&P dropped 4 but the Nasdaq gained 14. Today we are dealing with a nearly correlated market and it’s correlated to the upside.
Could this change? Of Course. Remember anything can happen in a volatile market.
Commentary
Yesterday the bears were once again in full bloom as the Dow dropped 119 points with this being the second 100 point drop for the Dow. Could it be not-too-stellar earnings being reported or perhaps everyone’s apprehensive as to whether or not President Trump can get anything passed in Congress. He went after Healthcare first as opposed to just passing tax breaks. We suspect he did this to placate the conservative portions of the GOP but they turned against him on healthcare and he still thinks it’s the Democrats fault. Mr President, your Freedom Caucus (ex Tea Party) went against you because the bill proposed was “Obamacare Lite” which they didn’t want. They won’t be satisfied until no subsidies are paid by the government. So now Wall Street is thinking that there won’t be any tax breaks forthcoming from DC but as always only time will tell.
Author

Nick Mastrandrea
Market Tea Leaves


