The Bears Growl…

Good Morning Traders,
As of this writing 4 AM EST, here’s what we see:
US Dollar: Sept. USD is Down at 93.440.
Energies: Sept Crude is Up at 47.32.
Financials: The Sept 30 year bond is Up 3 ticks and trading at 155.25.
Indices: The Sept S&P 500 emini ES contract is 6 ticks Lower and trading at 2428.00.
Gold: The Dec gold contract is trading Up at 1299.60. Gold is 71 ticks Higher than its close.
Initial Conclusion
This is not a correlated market. The dollar is Down- and Crude is Up+ which is normal but the 30 year Bond is trading Higher. The Financials should always correlate with the US dollar such that if the dollar is lower then bonds should follow and vice-versa. The indices are Down- and Crude is trading Up+ which is correlated. Gold is trading Down which is not correlated with the US dollar trading Down-. I tend to believe that Gold has an inverse relationship with the US Dollar as when the US Dollar is down, Gold tends to rise in value and vice-versa. Think of it as a seesaw, when one is up the other should be down. I point this out to you to make you aware that when we don’t have a correlated market, it means something is wrong. As traders you need to be aware of this and proceed with your eyes wide open.
At this hour Asia is trading mainly Lower with the exception of the Singapore exchange which is trading fractionally Higher. At this hour all of Europe is trading Lower.
Possible Challenges To Traders Today
– Prelim UoM Consumer Sentiment is out at 10 AM EST. This is major
– Prelim UoM Inflation Expectations is out at 10 AM EST. This is major.
– FOMC Member Kaplan Speaks at 10:15 AM EST. This is major.
Treasuries
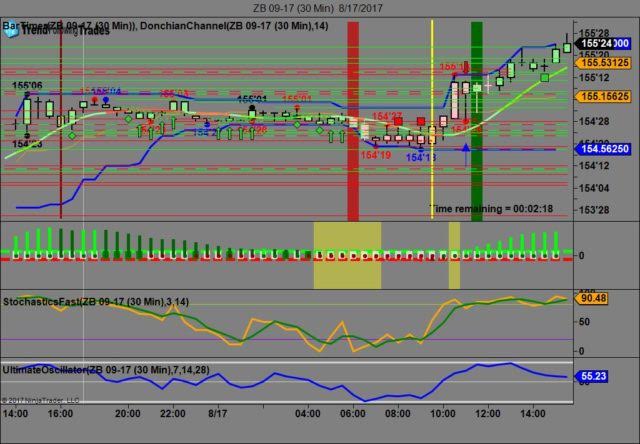
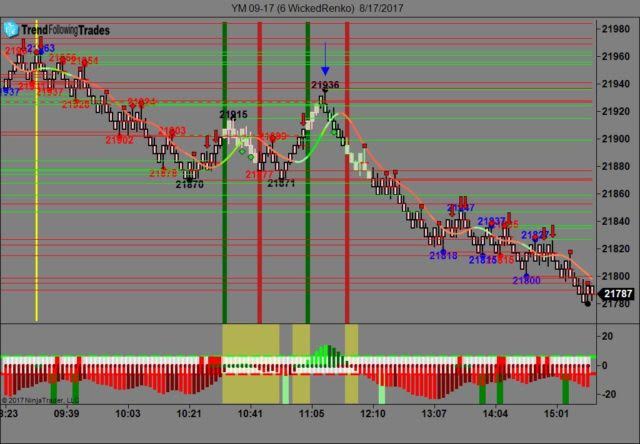
We’ve elected to switch gears a bit and show correlation between the 30 year bond (ZB) and The YM futures contract. The YM contract is the DJIA and the purpose is to show reverse correlation between the two instruments. Remember it’s liken to a seesaw, when up goes up the other should go down and vice versa.
Yesterday the ZB made it’s move at around 11 AM EST after the economic news was reported. The ZB hit a Low at around that time and the YM hit a High. If you look at the charts below ZB gave a signal at around 11 AM and the YM was moving Lower at the same time. Look at the charts below and you’ll see a pattern for both assets. ZB hit a Low at around 11 AM and the YM hit a High. These charts represent the newest version of Trend Following Trades and I’ve changed the timeframe to a 30 minute chart to display better. This represented a long opportunity on the 30 year bond, as a trader you could have netted about 30 plus ticks per contract on this trade. Each tick is worth $31.25. We added a Donchian Channel to the charts to show the signals more clearly. Please note that the front month for the ZB contract is now September, 2017.
Charts Courtesy of Trend Following Trades built on a NinjaTrader platform.
Bias
Yesterday we gave the markets a neutral bias as the USD and Bonds were both trading down yesterday morning however the futures weren’t moving in the right direction hence the neutral bias. The Dow closed lower by 274 points and the other indices didn’t fare too well either. Today we aren’t dealing with a correlated market and will maintain our neutral bias.
Could this change? Of Course. Remember anything can happen in a volatile market.
Commentary
As it turns out President Trump has decided to dissolve his Councils of Economic Growth as the members have left in droves. No one wants to be associated with a president that is presumed to be racist. Yesterday we warned that it wouldn’t take the Smart Money long to realize this and pull back on the markets. We didn’t realize that it would happen so quickly. The Dow dropped 274 points and the other indices fell as well; the Nasdaq dropped by triple digits also. Today we have preliminary numbers for consumer sentiment and inflation; both of which are major and proven market movers.
Author

Nick Mastrandrea
Market Tea Leaves


