The 1987 stock market crash revisited: Too many parallels to ignore, forewarned is forearmed

Over the last three years, ‘crash callers’ in the stock markets have failed miserably. Across the globe, equities have simply brushed off every possible economic/political/geopolitical risk to scale new heights. For many, equities have become the new safe haven or the only investment avenue that could offer attractive returns, given the near zero or negative rates in many parts of the world.
S&P 500 monthly chart
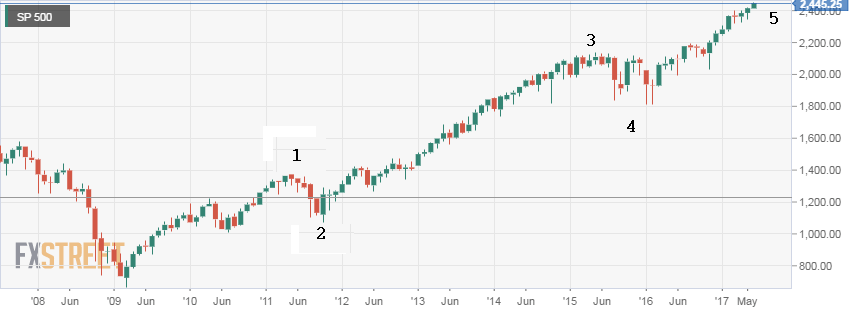
S&P 500 has more than doubled since 2009. The only notable pullbacks seen are the one in Q3 2011 & Q1 2016. The above chart also shows the 5th wave of the classic 5-wave structure is under progress. Watch out for a potential bearish RSI divergence.
Stocks are overvalued - BAML survey
A monthly survey from Bank of America Merrill Lynch shows a record 44% of the fund managers feel the equities are overvalued. The tech-heavy NASDAQ is the most overcrowded trade.
Most fundamental analysts hold the view that stocks are significantly overvalued… but, valuations are subjective. Moreover, the higher valuations could be sustained given the low rates and the fact that 40% of the S&P components offer yield higher than treasuries.
Monetary policy ion the advanced world remains ultra-accommodative. A potential risk on the horizon is Fed’s reverse QE. However, it is not on a preset course! So why discuss 1987? Well, there are too many parallels to be ignored.
S&P 500: Blue - Feb 1986 to Oct 1987, Red - Feb 2014 till date
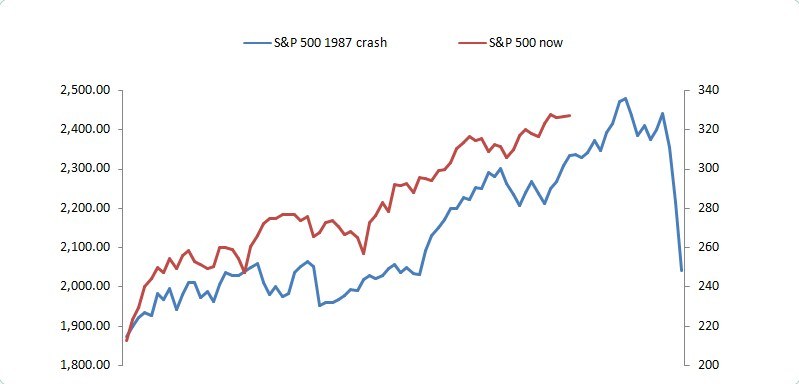
History repeats itself
| 1987 | 2017 |
|---|---|
| 1987: Monetary policy shock – Bundesbank rate hike, fears of Fed rate hike | 2017 – Monetary policy shock – Fed’s reverse QE and potential tightening by the ECB, BOJ |
| Dominance of computerized trading | Dominance of computerized trading |
| Overvalued markets | Overvalued markets |
| Oil sell-off: 1983-86 | Oil sell-off: 2014 till date |
| 1987: Reagan administration worried about trade deficit with West Germany & Japan | 2017: Trump administration criticizes German trade surplus and China trade practices |
| Geopolitical risks: Rise of the right wing, Geopolitical risks, Cold War, Iran-Contra affair | Geopolitical risks: Rise of the right wing, Russia scandal, NKorea tensions, Brexit |
| Reagonomics – implements tax cuts, expansionary fiscal policies | Trumponomics – Yet to deliver the expansionary fiscal policies |
The above table shows, there are too many parallels to be ignored. We would take a look at the first point - monetary policy shock.
1987 - Bundesbank surprises market with a rate hike
Following the 1985 Plaza Accord, the Japanese Yen and the Deutsche mark dramatically increased in value relative to the dollar. By 1987, the US government felt the USD sell-off was overdone. To correct the situation, the Group of Seven met in the Louvre Palace on the 22nd of February, 1987. It was agreed Japan and Germany, which had the strong currencies, were to cut the interest rate whilst the US would raise the rate.
The stock markets remained bid as Bundesbank was expected to cut rates and keep the 'liquidity tap' On. However, the accord ended abruptly after Bundesbank raised rates as it feared a rise in imported inflation (weak Deutsche Mark) due to a sharp rise in Japanese and UK-GILT bond yields.
Not only was the Bundesbank rate a shock, but the move also triggered speculation that the Fed would have to raise rates at a faster rate! The overvalued markets, thus tanked. The crash began in Hong Kong and spread west to Europe and to US.
American stock markets suffered one of its largest three-day declines in history, with the S&P 500 losing 28.5% of its value between October 14 and 19.
2017 - Markets are under appreciating the impact of Fed’s reverse QE, tightening across the advanced world
Fed’s has hiked rates 4 times since December 2015. The central bank is still reinvesting the proceeds of its bond holdings. Meanwhile, the ECB and the BOJ remain ultra-accommodative - (QE + Negative Rates). Thus, markets have remained bid despite four rate hikes in the US.
However, the Fed unveiled the plan to reduce its balance sheet this month. Markets were expecting the Fed to scale back its interest rate projections, given the string of weak economic data. But, the Fed maintained its hawkish interest rate outlook.
It is quite clear that the Fed wants to normalize the policy at the earliest so there is enough room available for rate cuts/QE during the next round of the recession. Somehow, the markets aren’t buying this. Sooner or later, the ECB and the BOJ will feel the compulsion to normalize the policy.
BIS to central banks - Push on with the great unwinding
The Bank of International Settlements also believes the time is ripe for the major central banks to unwind the massive stimulus. The bank said on Sunday, “policymakers should take advantage of the improving economic outlook and it’s surprisingly negligible effect on inflation to accelerate the "great unwinding" of quantitative easing programs and record low interest rates.”
A 10-15% pullback in equities would have an 87-like feel
Equities could be in for a potential shock if the Fed’s decision to stop reinvesting is accompanied by the ECB’s and/or BOJ’s hint at policy normalization. The sudden realization of a tighter monetary policy across the advanced world could easily yield a 10% to 15% pullback in the equity markets across the globe. It would have a 1987-like feel… meaning the pullback would be done within a week or two… more so because, like the 80s, the market is dominated by the Bots (machines). The volumes have dried up recently as well.
Investors moving into bonds…
As per Reuters Lipper data, investors turned to their all-time favorite safe haven of bonds, placing $3 billion in US-based, taxable, fixed-income funds during the week ended June 21st. Investors turned to their all-time favorite safe haven of bonds, placing $3 billion in US-based, The difference in yields between five-year notes and 30-year bonds flattened to 96 basis points during the week, the narrowest since December 2007 taxable, fixed-income funds during the latest week. The flattening of the yield curve clearly points the dwindling long-term inflation expectations and could also be due to the rise in safe haven/hedge demand for the long duration treasuries.
Global Credit Impulse has turned negative
Credit impulse is the change in new credit issued as the percentage of the GDP. The global credit impulse has plunged in the recent months from 4% of the global GDP to -2% of GDP. The rally in the stock markets, commodities - oil & industrial metals - from Feb 2016 lows was largely driven by the surge in the credit impulse (primarily pushed higher by China). It has turned negative… for the first time since 2009. It is quite clear; the macro/fundamental isn’t in favor of another leg higher in the stocks either.
This is not one of the ‘crash calls’, but merely a note that the situation seems eerily similar to the one seen before the 1987 crash. Calling a top is as dangerous as trying to catch a falling knife. However, one can stay vigilant during the next 6 months or so and given that Options IVs are low (option are cheap, VIX is near record lows), one should consider long gamma, long vega option plays like straddle/strangle.
It won’t be an economic crash
The 1987 crash was not the result of a financial crisis, nor did it lead to a prolonged recession. On similar lines, a major sell-off this year or early next year won’t lead to recession… simply because no major economy in the world is witnessing an economic boom!
Forget the parallels if Trump’s fiscal stimulus meets market expectations on the higher side
The odds are low, but never say ‘never’. Stock markets would extend the rally if President Trump walks the talk - beats market expectations with ‘Yuuge tax cuts and fiscal spending program’.
Author

Omkar Godbole
FXStreet Contributor
Omkar Godbole, editor and analyst, joined FXStreet after four years as a research analyst at several Indian brokerage companies.