Crude Oil price forecast: Sell-off could get worse if Saudi throws in towel… the way it did in 1985

Oil benchmarks officially entered the bear market territory last week as the OPEC’s decision to extend the output cut deal failed to push the markets into backwardation. In simple terms, markets do not think the output cut extension is enough to counter the increased supplies from the US.
Brent’s yearly high is $58.35 and WTI’s high is $55.21. Both are down close to 20% and the speculation is on the rise that the bear market is unlikely to reverse any time soon. If history is anything to go by, the sell-off may actually worsen…
1985 – Saudi begins producing at full capacity
From 1980, the OPEC decreased oil production several times in order to defend prices. By 1981, the non-OPEC nations were making their presence felt. Saudi slashed its own output from more than 10 million barrels per day in 1980 to less than 2.5 million bpd in 1985-86.
However, other producers – OPEC and non-OPEC, did not follow suit. Finally, Saudi abandoned its role as a swing producer and began producing at a full capacity in September 1985. That created a huge surplus, pushing the prices lower to $7/barrel.
2017 – OPEC members aren’t complying
According to Bloomberg survey of analysts, oil companies and ship-tracking data, Angola, Iraq are not complying with the OPEC’s decision to reduce oil output. Nigeria and Libya aren’t bound by the output cuts deal.
Libya was producing 700K barrels in April and is now pumping 850K barrels per day. Saudi has already failed to crowd out US Shale and Iranian oil producers. Russia could also increase oil production to up to 11.07 million barrels per day, next year.
History might repeat itself – Saudi may throw in the towel due to the rising Shale output and growing evidence of OPEC non compliance.
US Oil rig count continues to rise…
The Baker Hughes data released on Friday showed the total oil and gas rig count in the US now stands at 941 rigs, which is 520 rigs over a year ago today. WTI oil prices traded at $51.00 levels a year ago, while Brent traded near $53.00 levels.
The subsequent sell-off in oil prices despite the global output deal clearly indicates the market still believes that the OPEC output cut deal is subsidizing Shale barrels.
Technicals – oversold in the short-run, little hope on larger scheme of things
The RSI is oversold on the daily chart of Brent and WTI, hence a technical correction cannot be ruled out. However, it is more likely to be short lived, given the nice rounding top kind of pattern seen on the weekly charts below.
Brent weekly chart
-636340635967050856.jpg)
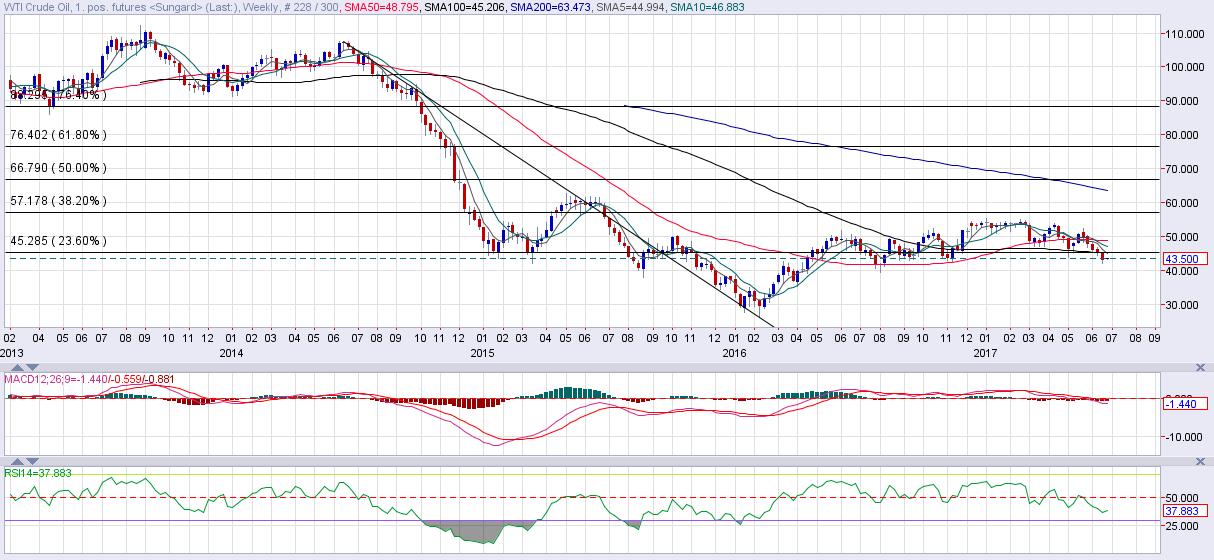
The RSI is back below 50.00 levels and the MACD shows the bearish momentum is gathering pace.
Corrective rally due to oversold conditions could run out of steam around $48.00 (23.6% Fib R of 2014 high – 2016 low).
Bullish OPEC sound bites, coupled with short-term oversold conditions may yield $50.00 levels; however, on a larger scheme of things, prices appear on track to revisit $41.51 levels (Aug 2016 low).
Prices may tank to $21.10 (Jan 2016 low) if history repeats itself (Saudi starts producing at full capacity).
Similar set up is seen on the WTI Crude weekly chart
Author

Omkar Godbole
FXStreet Contributor
Omkar Godbole, editor and analyst, joined FXStreet after four years as a research analyst at several Indian brokerage companies.


