Technical structure for the week ahead

US Dollar Index still going strong
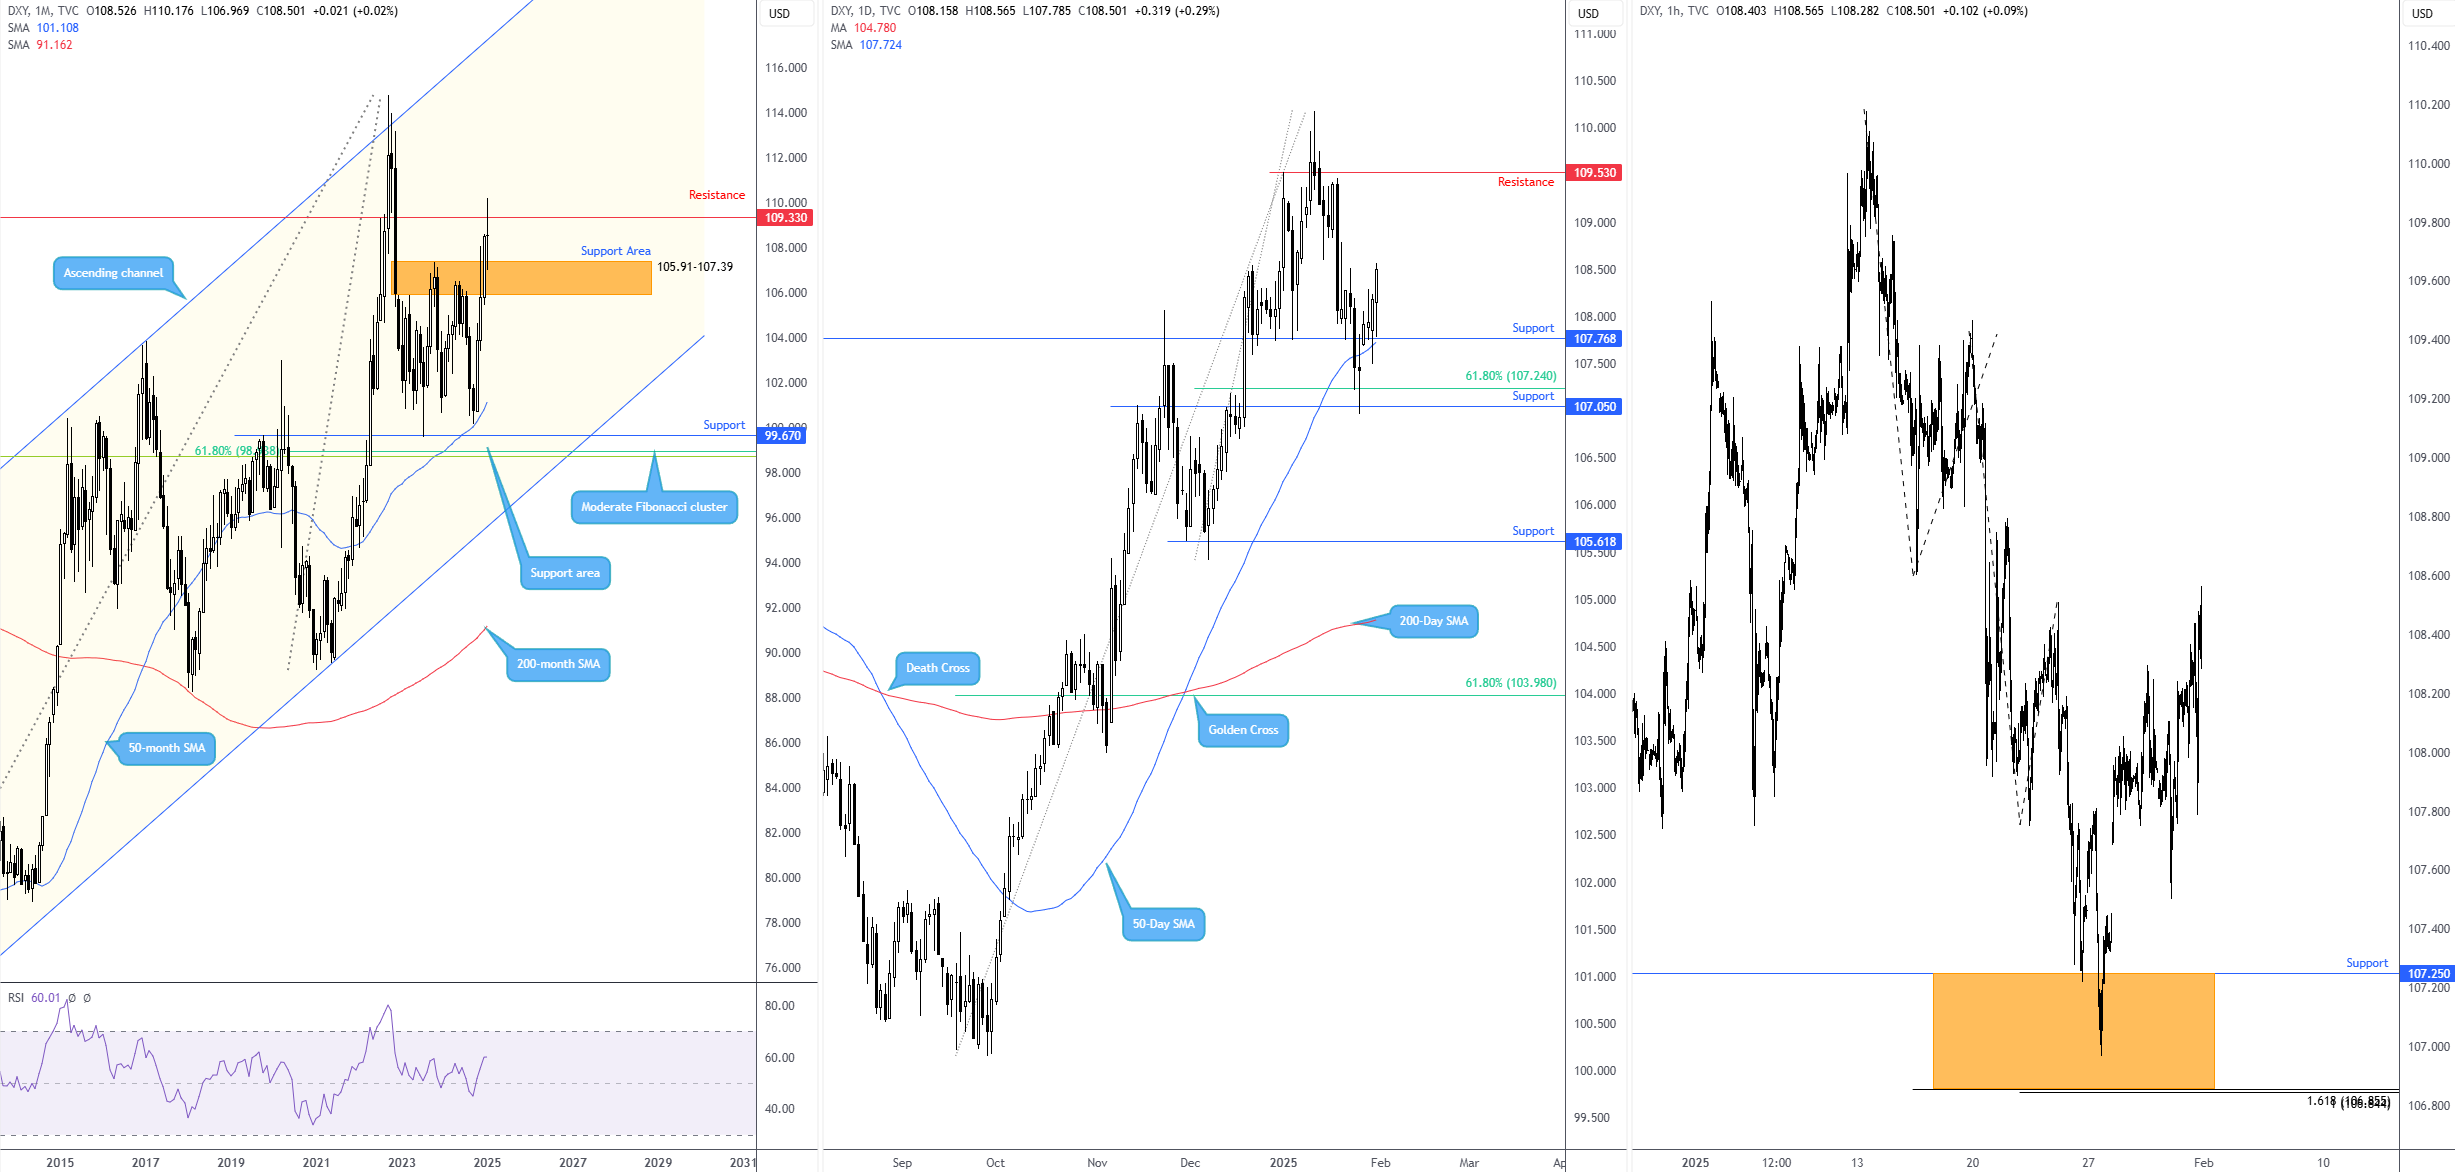
The US Dollar (USD) Index recently presented strong technical confluence supporting a USD rebound, which aligns with the underlying macro narrative. Earlier last week, you may recall, I underscored the possibility of a USD bid on the following observations:
- Local monthly support at 105.91-107.39, the 50-month (101.11) and 200-month (91.16) simple moving averages (SMAs) are higher (the 50-month SMA has also been north of the 200-month SMA since early 2017) and, finally, the monthly chart’s Relative Strength Index (RSI) has maintained position north of the 50.00 centreline since 2021 (positive momentum).
- Daily support, which included the 50-day SMA at 107.72, a 61.8% Fibonacci retracement ratio at 107.24, and support at 107.05.
- H1 support between a 1.618% Fibonacci projection ratio at 106.86 (harmonic traders may recognise this as an ‘alternate’ AB=CD bullish setup), as well as a 100% projection ratio at 106.84 (‘equal’ AB=CD formation), coupled with the upper limit support at 107.25.
As evident from the charts below, the USD Index has run higher since and gained a foothold above 107.77 resistance on the daily timeframe, which, following the recent retest, I have marked support. With price north of 107.77, buyers may feel the ‘path of least resistance’ is now towards monthly resistance, coming in at 109.33, closely followed by daily resistance from 109.53.
GBP/USD rebounding ahead of the Bank of England’s (BoE) rate announcement
The GBP/USD (British pound versus the US dollar) will be in focus this week, as the BoE is expected to reduce the Bank Rate by 25 basis points to 4.50% from 4.75%.
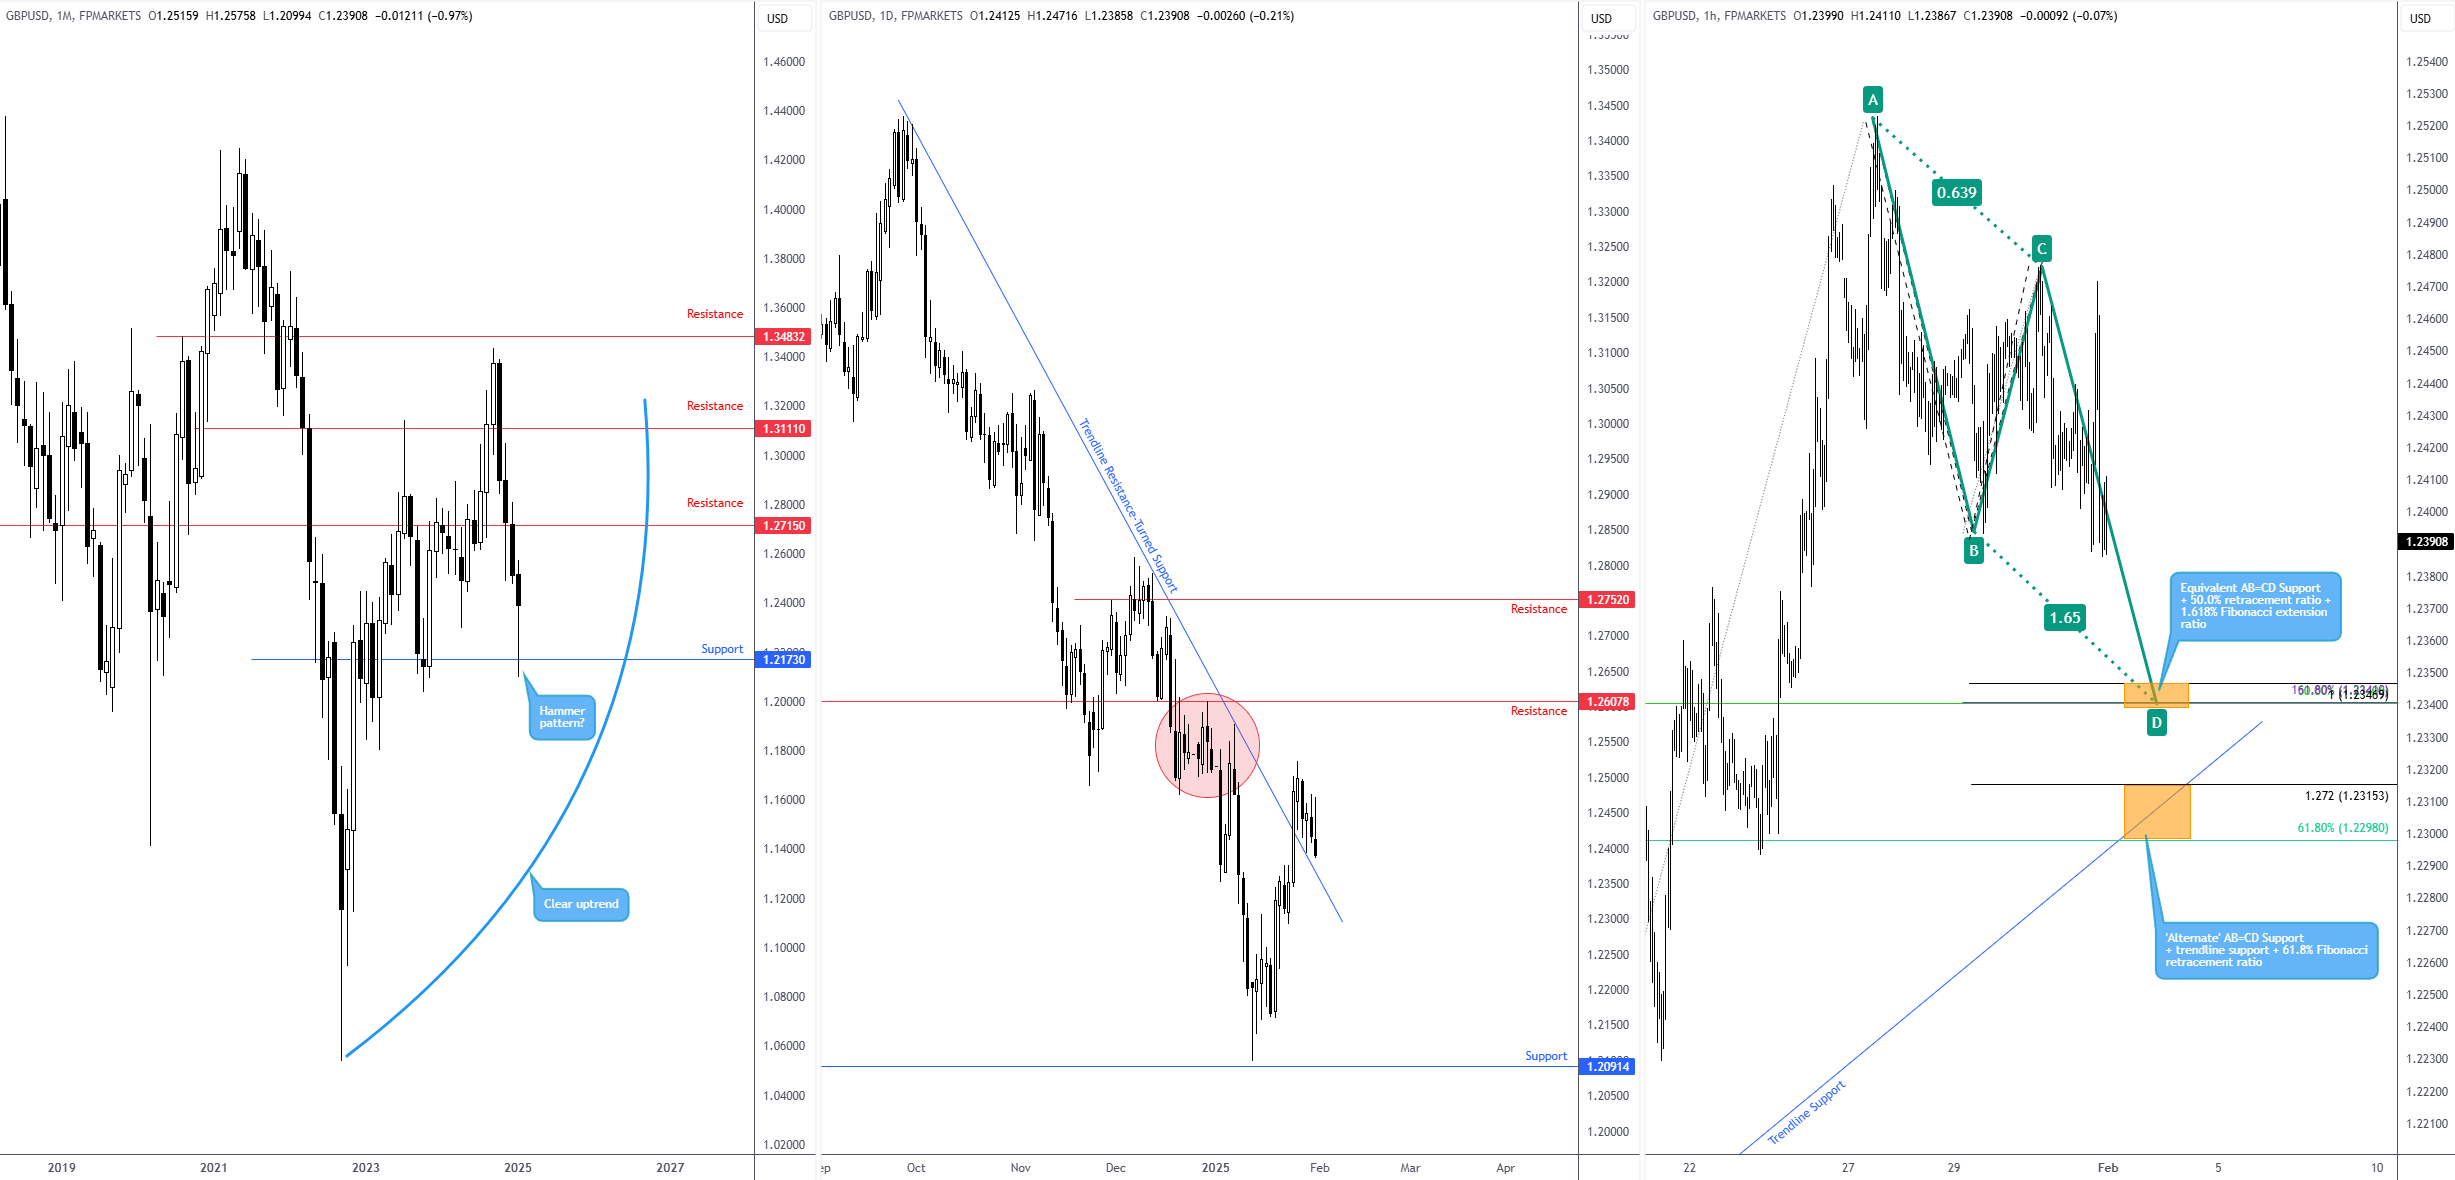
Although the currency pair finished another month on the ropes – down 1.0% – January traded off worst levels and delivered a hammer pattern to work with on the monthly chart from support at US$1.2173. Granted, while the hammer formation is not ideal (featuring a moderate upper shadow and a larger real body than preferred), it demonstrates that buyers are attempting to regain position and marks a deceleration in downside momentum.
Meanwhile, from the daily chart, price came within striking distance of connecting with support from US$1.2091 on 13 January (for those interested, this price action shows a textbook hammer pattern: a clear lower shadow and no obvious upper shadow [some analysts may also categorise this formation as a ‘dragonfly doji’; regardless, they are both considered bullish signals]). Subsequent price movement witnessed the pair manoeuvre beyond trendline resistance, taken from the high of US$1.3434. While price has failed to print much follow-through here – likely due to leftover offers around supply at the US$1.2550ish area (red circle) – and appears poised to retest the breached trendline resistance as support, buyers will likely have gas left in the tank for a push towards resistance at US$1.2608. However, the area of resistance above here may interest traders more at US$1.2752, given the base resides just above monthly resistance of US$1.2715.
Given the upside bias, I will be watching two areas of support on the H1 scale this week. The higher of the two is found at US$1.2341-US$1.2347 (made up of equal AB=CD support, a 50.0% retracement ratio and a 1.618% Fibonacci extension and is located just beneath the daily trendline ‘support’). The lower support falls in between US$1.2298 and US$1.2315 (‘alternate’ AB=CD Support [1.618%], trendline support, and a 61.8% Fibonacci retracement ratio).
XAU/USD: Spot Gold at record highs; overbought?
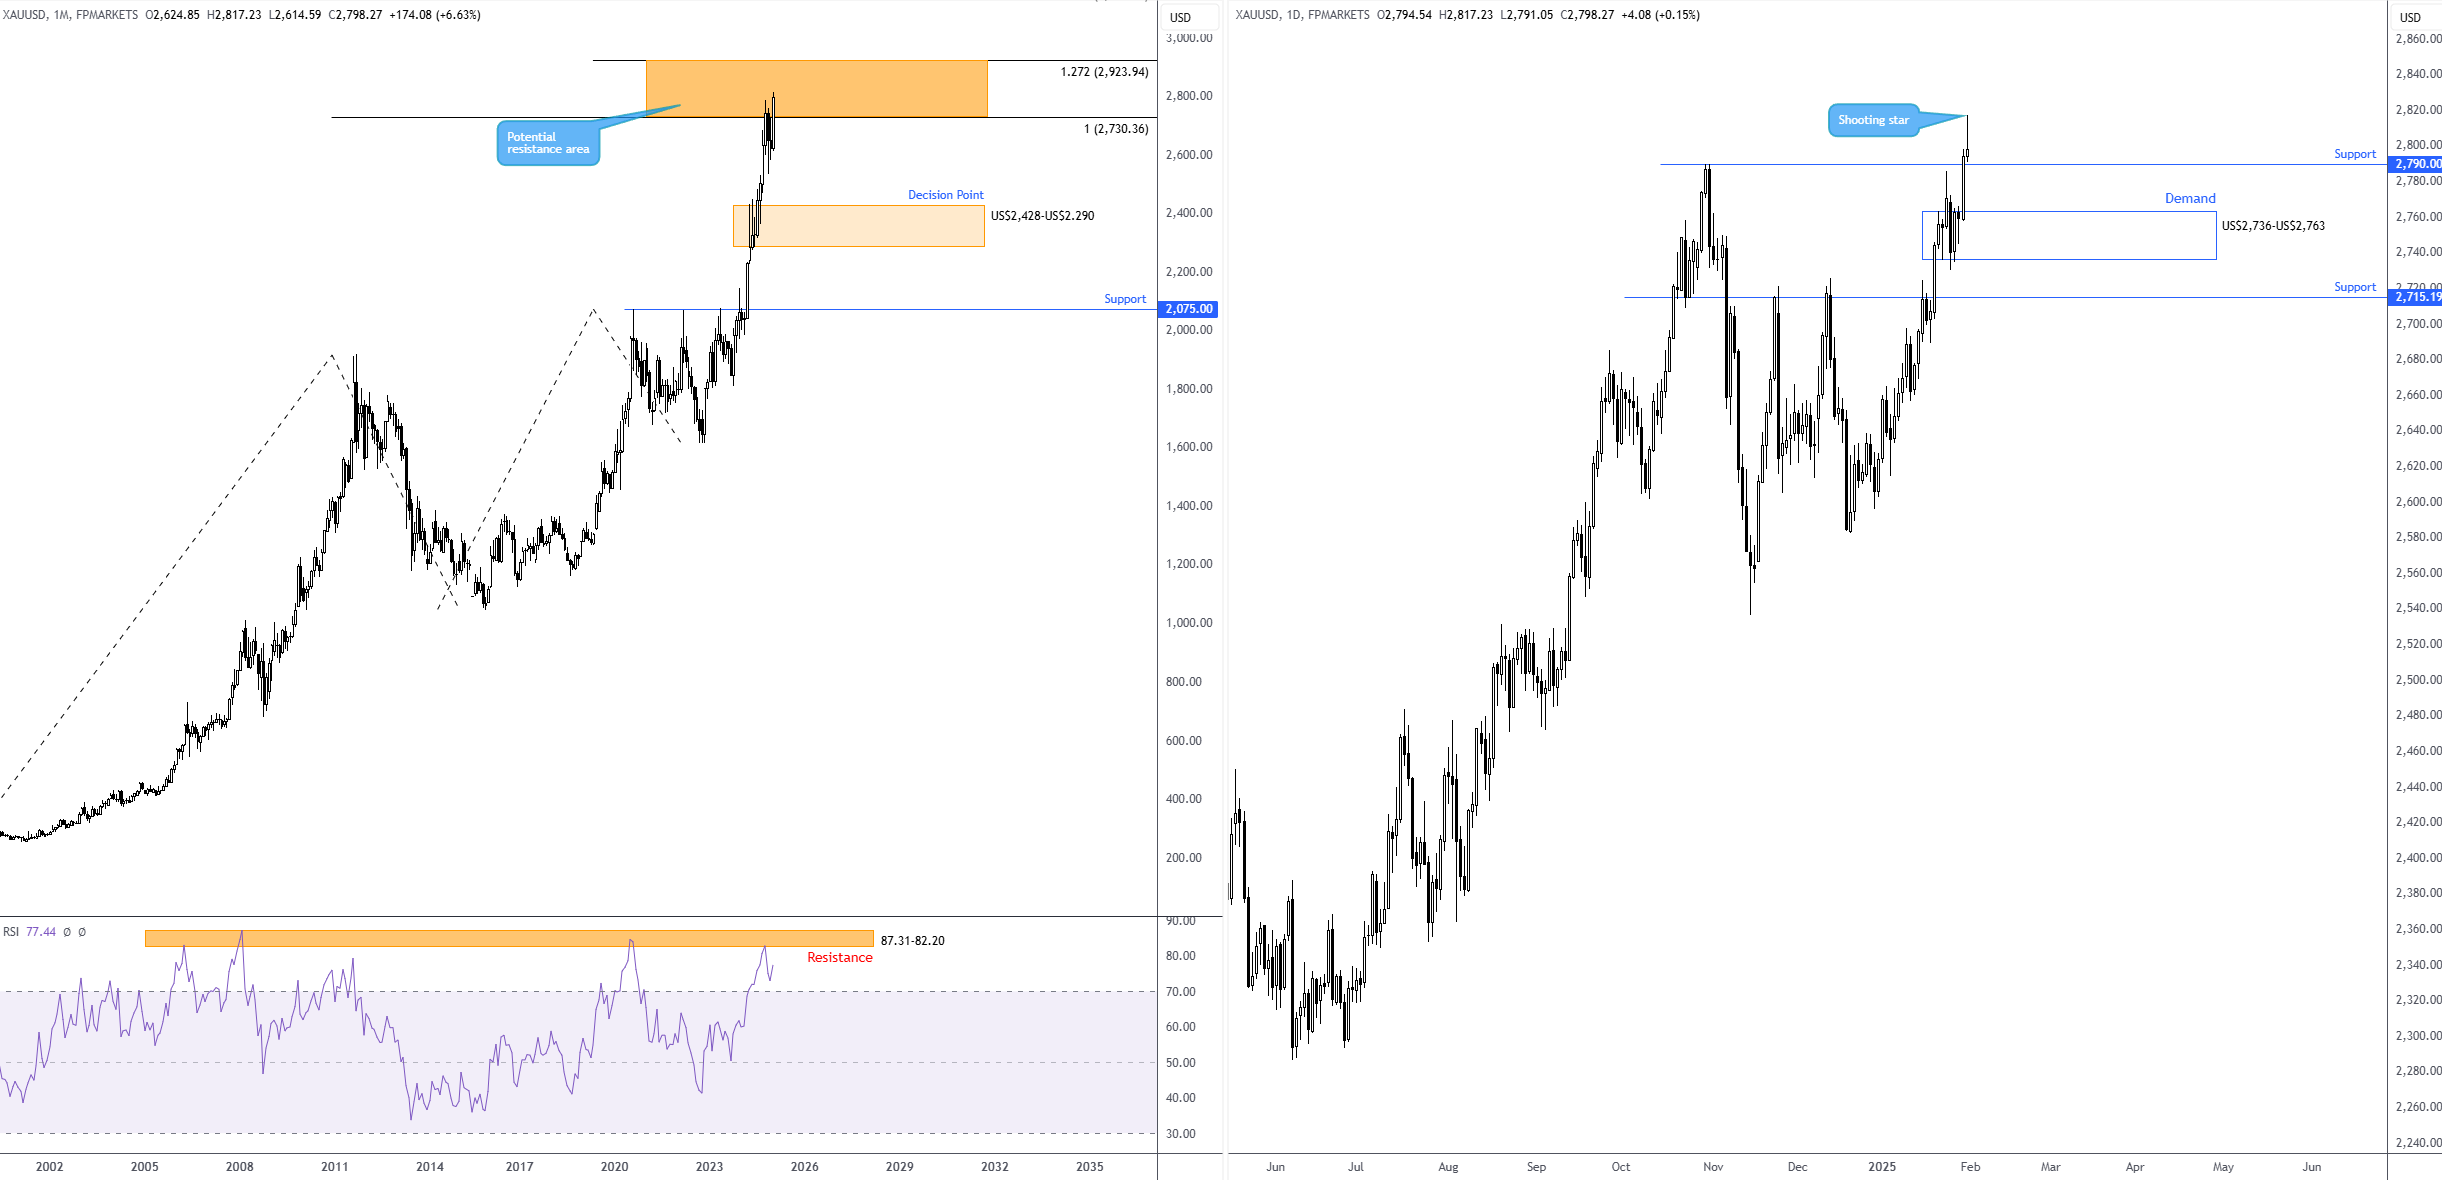
Versus the US dollar, spot gold climbed to a fresh all-time high of US$2,817 last week, though, given current chart studies, it could be due a retracement.
The monthly timeframe is knocking on the door of resistance between US$2,923 and US$2,730 (formed by a 1.272% Fibonacci projection ratio and a 100% projection ratio, respectively). Additionally, the RSI recently touched gloves with resistance located in overbought territory at 87.31-82.20. While the uptrend suggests investors will continue to bid gold, a decision point from US$2,428-US$2.290 may be worth pencilling in the watchlist if a long-term correction materialises.
What is interesting from a technical perspective on the daily timeframe is that Friday wrapped up in the shape of a shooting star bearish candle after refreshing record highs. Nevertheless, this week will be about support from US$2,790.
Countertrend sellers will likely opt for caution at current levels, given support at US$2,790. If price manages to close south of the aforementioned line, this may prompt selling towards demand at US$2,736-US$2,763, closely followed by another layer of support from US$2,715. Conversely, were buyers to defend US$2,790, tripping stops above the shooting star’s upper shadow, refreshing all-time highs, and driving price higher into monthly resistance mentioned above at US$2,923-US$2,730 could all be on the table.
BTC/USD on the edge
Another market I touched on last week was BTC/USD (Bitcoin versus the US dollar), and it was essentially underlined that buyers are strengthening their grip and could continue to do so in the weeks (possibly months) ahead.
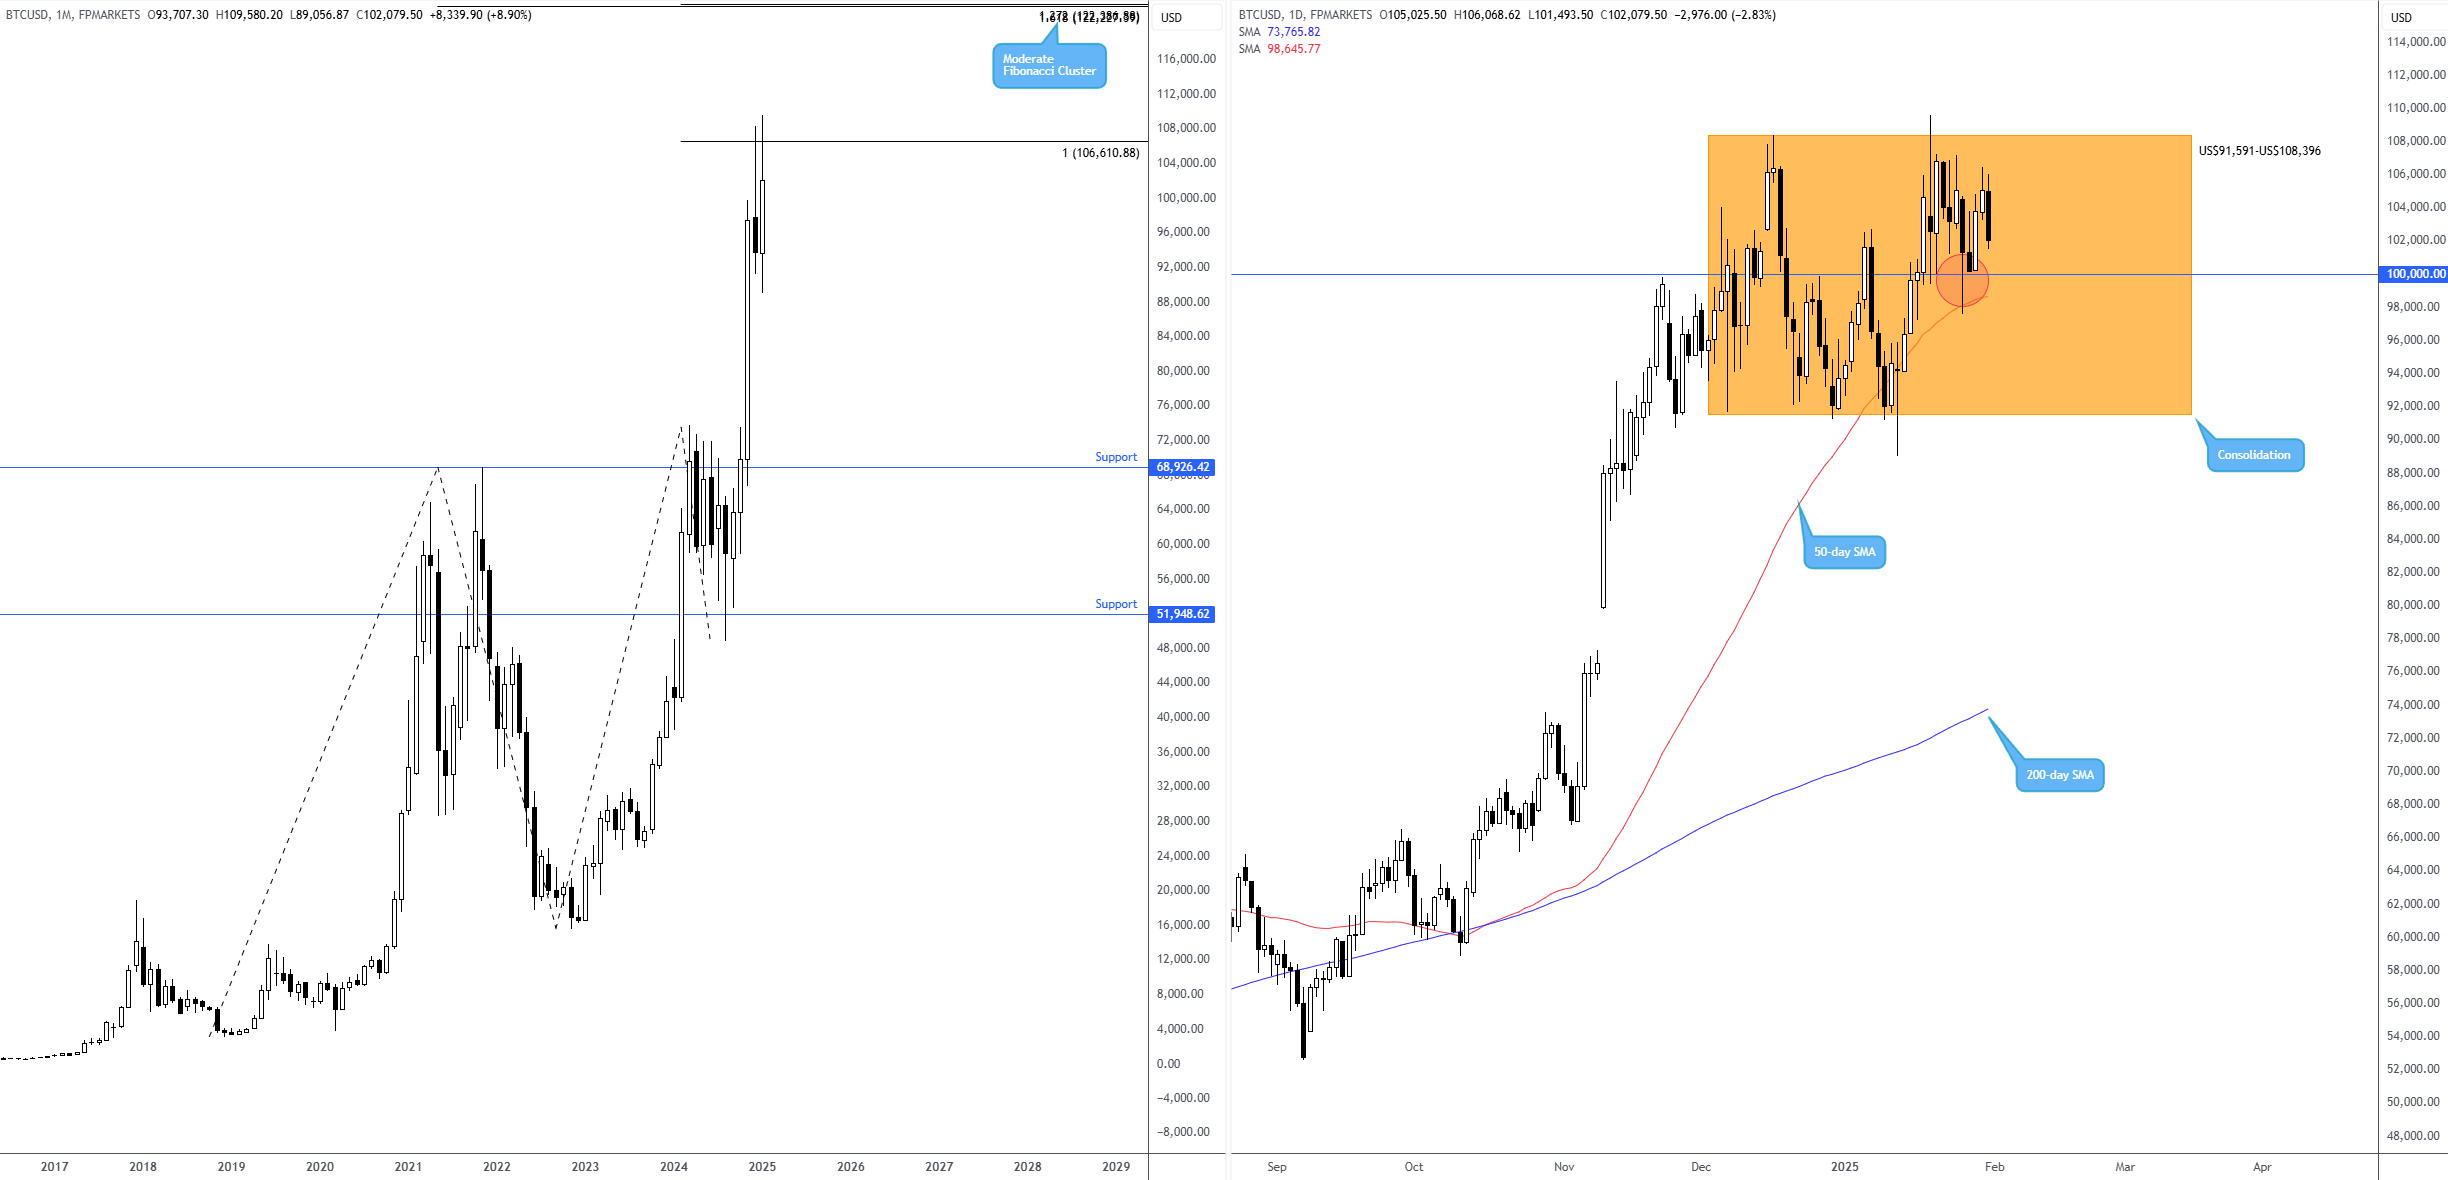
There is not much to talk about on the monthly chart right now except to remind ourselves that last year wrapped up touching the underside of a 100% projection ratio at US$106,610. While December 2024 delivered a half-hearted bearish shooting star pattern (I prefer these structures to have little to no lower shadow), January observed bulls return in force, ending the month up 9.0% and engulfing December’s range. Were buyers to pull things beyond US$106,610, the next logical upside target (for me, anyway) would be a moderate Fibonacci projection cluster at approximately US$122,000, consisting of 1.272% and 1.618% Fibonacci projection ratios.
Across the page on the daily timeframe, basic analysis demonstrates a clear-cut range has been in play since December 2024, between US$91,591 and US$108,396. Although it is common to fade the limits of defined consolidation areas, I also monitor for strengths and weaknesses within the zone. Take current action, for example. Following the formation of the upper limit of the current range, price failed to find acceptance south of the 50-day SMA at US$98,645 and US$100,000 (in fairness, US$100,000 is obvious support with a number of traders/investors likely seeking to play the retest off of this level) and has seen price rebound from the area, indicating buyers are gaining in strength. Couple this with the clear upward trend that BTC/USD is in, a breakout higher and fresh record highs should not raise too many eyebrows.
Author

Aaron Hill
FP Markets
After completing his Bachelor’s degree in English and Creative Writing in the UK, and subsequently spending a handful of years teaching English as a foreign language teacher around Asia, Aaron was introduced to financial trading,


