Technical Market Outlook and Review for 20 January

EUR/USD
Thursday presented another sluggish trading day around Wednesday’s range lows.
As aired in Thursday’s technical briefing, price action on the weekly scale touched gloves with the underside of major resistance from $1.0888: Quasimodo support-turned resistance. This, in a market still considered exhibiting a downside bias on the weekly timeframe, brands the aforementioned level a central base to monitor.
Scaling down to the daily timeframe, the research team’s outlook also remains unchanged on this chart. Here is where the team left things in previous writing (italics):
In support of the weekly resistance level, prime resistance on the daily timeframe at $1.0954-1.0864 recently made a show. However, on the daily chart, an uptrend is clear through the recent series of higher highs/lows, as well as price crossing above its 200-day simple moving average, currently fluctuating around $1.0308. We can also see that the moving average is starting to level off from its down move: another sign of a potential trend reversal to the upside. The Relative Strength Index (RSI) on the daily chart, nonetheless, is seen printing early negative divergence, effectively backing a downside move from the daily prime resistance.
It was noted in Thursday’s analysis that the H1 timeframe has been confined to a range between $1.0780 and $1.0868 since 12 January. As evident from the chart, despite attempts to find acceptance north of the $1.08 figure during the London session on Thursday, US hours saw the EUR/USD step back under the psychological level. Despite recent price reclaiming position above the round number, the fact price struggled above the figure still threatens the lower limit of the aforesaid consolidation.
The research team pencilled in the following in recent writing (italics):
Overall, given the active weekly and daily resistances, and the weekly timeframe’s bearish narrative still in play, a break of the H1 timeframe’s range is likely to be seen to the downside. Such an event materialising might see short-term breakout sellers surface south of the H1 Quasimodo resistance-turned potential support at $1.0764, targeting H1 Quasimodo support from $1.0743 and the $1.07 figure.
Therefore, as above, buyers are likely thin at current levels and a break of the lower side of the H1 range remains on the table.

S&P 500
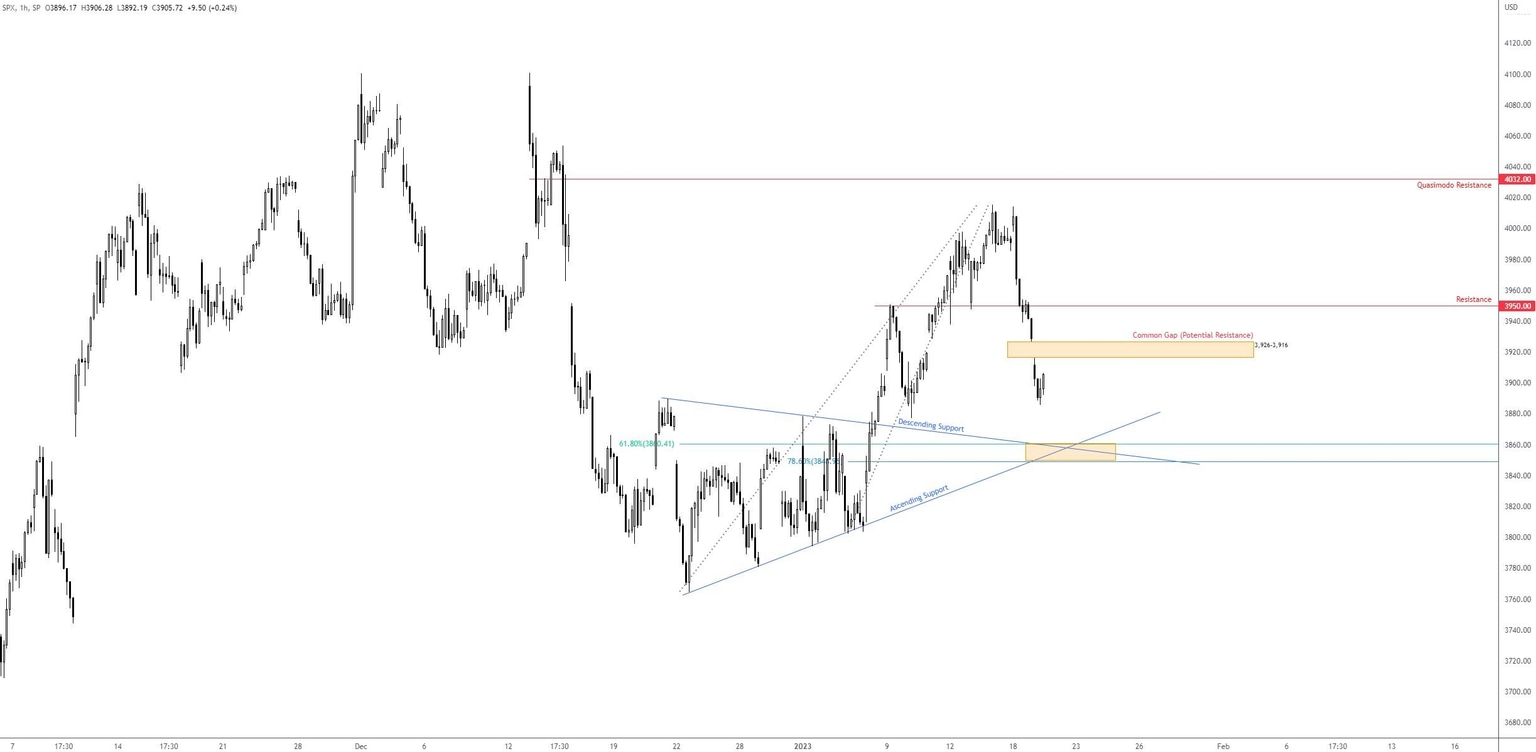
Week to date, the S&P 500 is down 2.4%, as of writing. Following a round of disappointing US retail sales and PPI inflation data on Wednesday, the index logged a 1.6% drop, its largest one-day decline in a month. US equities followed through to the downside in early trading on Thursday, forging a downward gap at the open, effectively gapping beneath the previous upside gap between 3,919 and 3,928 seen on the H1 timeframe.
Although the case for a follow-through bullish move was evidenced in the technicals, the weekly timeframe’s trendline resistance, drawn from the high at 4,818, is doing its job: rejecting price. And with the daily action voyaging south of support at 3,921 in recent movement, downside risks unearth a potential move towards daily support coming in at 3,796.
As a reminder (italics—previous analysis), the monthly chart has remained in a dominant uptrend since early 2009. We had two notable corrections in that time, one in early 2020 (COVID), dropping 35%, and one currently in play since early 2022 (down 27% from 4,818, as of writing) which was accompanied by negative divergence out of the Relative Strength Index (RSI).
Back to the H1 scale, the opening downside gap between 3,926 and 3,916 could welcome sellers should a pullback emerge, though continuation selling re-opens the door for an approach to support between 3,848 and 3,860. This area consists of 78.6% and 61.8% Fibonacci retracement ratios, alongside an ascending support, drawn from the low of 3,764 and a descending support, taken from the high of 3,889.
Monthly, Weekly and Daily Charts:

H1 Chart:
XAU/USD (Gold)
Despite marginally violating trendline support on the H1 chart (green), drawn from the low $1,825, buyers found grip and reclaimed position north of the ascending line on Thursday. Another technical observation on the H1, which also bolsters a bullish case for the yellow metal, is that the first leg lower from $1,929 (16 January) bottomed at $1,896, while the second leg south from $1,925 (18 January) failed to form a lower low at $1,901.
This informs market participants that buyers are gaining traction and a break above the local descending resistance (etched from $1,929) could be breached today.
Based on the weekly timeframe, price is attempting to find a reception above resistance at $1,916, with a break to the upside potentially calling on the double-top pattern’s peaks at around $2,070. However, it’s important to note that the Relative Strength Index (RSI) is at the doorstep of overbought territory.
The daily timeframe, on the other hand, supports further outperformance, in favour of an approach to a Quasimodo formation at $1,966, closely accompanied by a 78.6% Fibonacci retracement at $1,973 (not visible on the chart). Nevertheless, similar to the weekly chart, the daily timeframe’s RSI is registering overbought conditions, therefore a correction to the decision point at $1,867-1,886 could still be seen.
As for the trend on the daily, the research team noted the following in recent writing (italics):
The trend, according to the daily chart, is now technically higher. The reversal presented itself in early December last year following the break of the $1,786 previous high in November 2022. Since then, the precious metal also recently welcomed what is known as a Golden Cross, which is the 50-day simple moving average ($1,806) crossing above the 200-day simple moving average ($1,777). This is a pattern trend followers tend to watch and can signal the possibility of a long-term uptrend surfacing.
Ultimately, should H1 make its way above the local descending resistance ($1,929), this bolsters the case for another leg higher and places H1 resistance on the radar at $1,939.

BTC/USD
It was a quiet day for the major cryptocurrency on Thursday, as of US trading hours. Given this lacklustre performance, much of the following will echo thoughts put forward in Thursday’s technical briefing.
The research team noted the following (italics):
The weekly timeframe shows BTC/USD gained some grip north of support at $11,855 and hammered through the upper limit of a falling wedge pattern (reversal structure), drawn between $25,214 and $17,567. You will note this was accompanied by the Relative Strength Index (RSI) chalking up positive divergence ahead of oversold territory (the indicator also recently crossed above its 50.00 centreline [positive momentum]). Aside from the local tops (more evident on the daily chart), resistance demands attention at $28,844.
Meanwhile on the daily timeframe, price movement continues to consolidate recent gains between support at $20,000 and resistance coming in from $21,924. According to the daily chart, things appear to be improving for the major crypto. The recent outperformance forged a fresh higher high (breaking the $18,385 14 December high), and crossed above both the 50-day and 200-day simple moving averages, currently trading at $17,539 and $19,550, respectively. However, it is important to remember that prior to the above, this market was entrenched in a dominant downtrend since late 2021. This, in addition to the RSI testing highs (89.35) not seen since early 2021, could still see sellers put in an appearance.
Across the page on the H1 timeframe, Thursday remained under the breached rising wedge pattern, drawn between $21,321 and $20,233. Should sellers maintain position under the breached level, a push as far south as a decision point from $19,731-19,998 could be on the table still. Although a breakout of the weekly timeframe’s pattern was seen to the upside, the H1 decision point at $19,731-19,998 continues to demand attention. Merging closely with the 20,000-support marked on the daily timeframe, the H1 zone may be somewhere the charts see buyers appear.

Economic Radar Today
Month-Over-Month UK Retail Sales Data for December at 7:00 am GMT (Expected: 0.5%; Previous: -0.4%).
European Central Bank (ECB) President Christine Lagarde Due to Speak at 10:00 am GMT.
Month-Over-Month Canada Retail Sales Data for November at 1:30 pm GMT (Expected: -0.5%; Previous: 1.4%).
US Existing Home Sales Data (Annualised) for December at 3:00 pm GMT (Expected: 3.96M Previous: 4.09M).
Author

Aaron Hill
FP Markets
After completing his Bachelor’s degree in English and Creative Writing in the UK, and subsequently spending a handful of years teaching English as a foreign language teacher around Asia, Aaron was introduced to financial trading,


