|

Technical Analysis – USDJPY edges sharply lower below symmetrical triangle; records fresh 15-month low

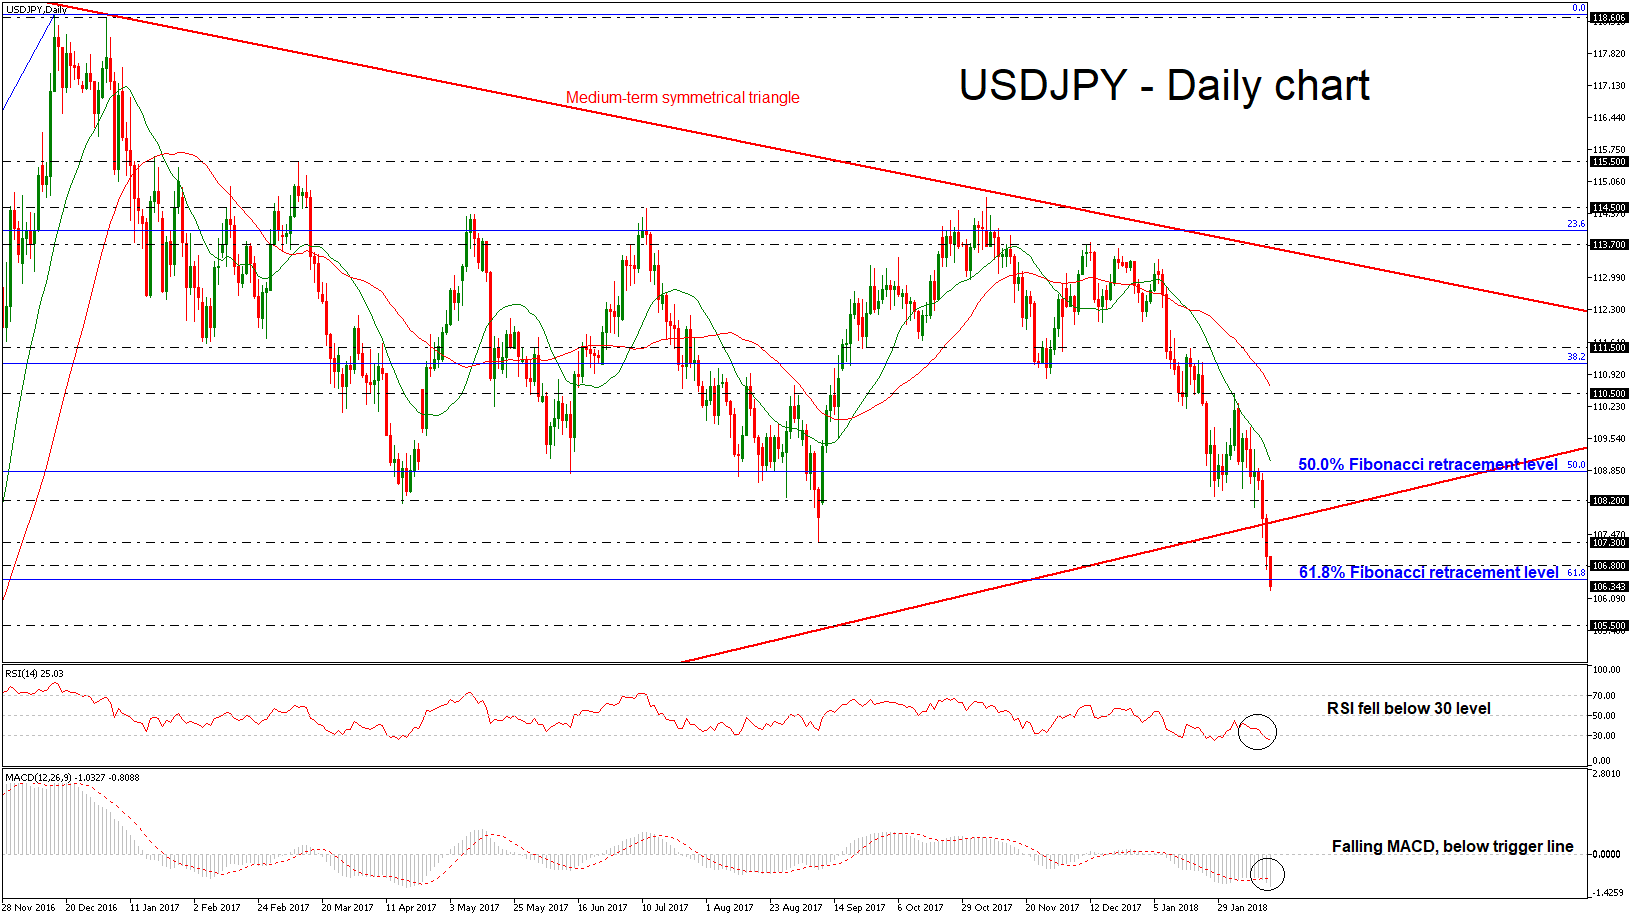
USDJPY dipped sharply lower on Wednesday, while it posted the third red day in a row and created a new 15-month low of 106.29 during today’s Asian session. The aggressive bearish rally started after the fall below the 50.0% Fibonacci retracement level near 108.80 of the up-leg with the low of 98.96 and the high of 118.60 and drove the price below the symmetrical triangle, which has been holding since May 2015. A weekly close below the triangle could reinforce the downside pressure.

Short-term momentum indicators in the daily timeframe are also pointing to a continuation of the bearish bias. The Relative Strength Index (RSI) slipped below the 30 level and is challenging the oversold zone. Also, the MACD oscillator recorded a downside crossover with its trigger line with strong momentum, suggesting further losses.

If prices continue the sharp sell-off, immediate support could come at 105.50, which is taken from the high in October 2016. It is worth mentioning that the price has just hit the 61.8% Fibonacci retracement level near 106.50 and is ready to break it to the downside.

Conversely, in case of an upward correction, the pair needs to go through the medium-term ascending trend line and the 108.20 resistance level. A jump above the aforementioned levels, the price could open the door for the 110.50 obstacle.

USDJPY

Author

XM Research Department

Manned by a powerful team of professionals, along with certified forex instructors, the XM Research and Education Center provides a full range of up-to-date marketing tools essential for profitable trading, including market analys

More from XM Research Department
Share:

Editor's Picks

EUR/USD tests nine-day EMA support near 1.1850

EUR/USD remains in the negative territory for the fourth successive session, trading around 1.1870 during the Asian hours on Friday. The 14-day Relative Strength Index momentum indicator at 56 stays above the midline, confirming steady momentum. RSI has eased but remains above 50, indicating momentum remains constructive for the bulls.

GBP/USD consolidates around 1.3600 vs. USD; looks to US CPI for fresh impetus

The GBP/USD pair remains on the defensive through the Asian session on Friday, though it lacks bearish conviction and holds above the 1.3600 mark as traders await the release of the US consumer inflation figures before placing directional bets.

Gold recovers swiftly from weekly low, climbs back closer to $5,000 ahead of US CPI

Gold regains positive traction during the Asian session on Friday and recovers a part of the previous day's heavy losses to the $4,878-4,877 region, or the weekly low. The commodity has now moved back closer to the $5,000 psychological mark as traders keenly await the release of the US consumer inflation figures for more cues about the Federal Reserve's policy path.

Solana: Mixed market sentiment caps recovery

Solana is trading at $79 as of Friday, following a correction of over 9% so far this week. On-chain and derivatives data indicates mixed sentiment among traders, further limiting the chances of a price recovery.

A tale of two labour markets: Headline strength masks underlying weakness

Undoubtedly, yesterday’s delayed US January jobs report delivered a strong headline – one that surpassed most estimates. However, optimism quickly faded amid sobering benchmark revisions.

Solana Price Forecast: Mixed market sentiment caps recovery

Solana (SOL) is trading at $79 as of Friday, following a correction of over 9% so far this week. On-chain and derivatives data indicates mixed sentiment among traders, further limiting the chances of a price recovery.