|

Technical analysis: Will the USD/CHF quotes increase?

Recommendation for USD/CHF: Buy

Buy Stop: Above 0.92

Stop Loss: Below 0.9

IndicatorValueSignal
RSI Buy
MACD Buy
MA(200) Neutral
Fractals Neutral
Parabolic SAR Sell
Bollinger Bands Neutral

Chart Analysis

USDCHF

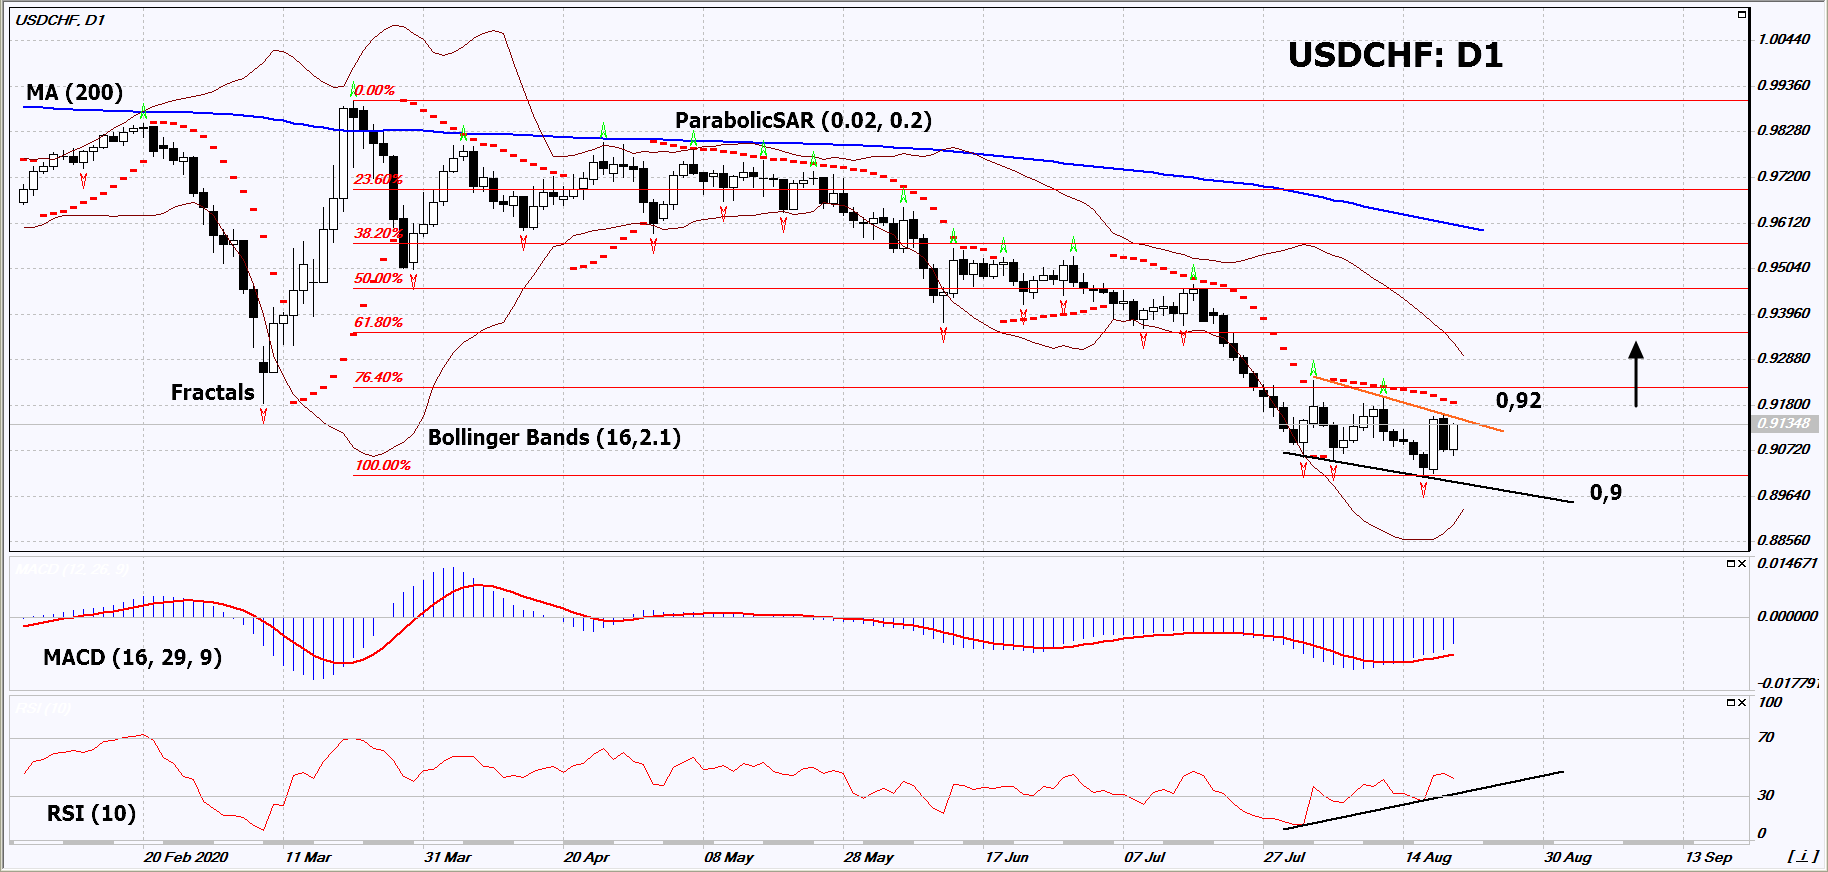
On the daily timeframe, USDCHF: D1 was unable to overcome the psychological support level of 0.9. The pair began to rise and approached the downtrend resistance line. It must be broken upward before opening a position. A number of technical analysis indicators formed signals for further growth. We do not exclude a bullish move if USDCHF rises above its last upper fractal and Parabolic signal: 0.92. This level can be used as an entry point. The stop loss can be placed below the last bottom fractal and minimum since January 2015: 0.9. After opening a pending order, we move the stop loss following the Bollinger and Parabolic signals to the next fractal low. Thus, we change the potential profit/loss ratio in our favor. After the transaction the most risk-averse traders can switch to the four-hour chart and set a stop loss, moving it in the direction of the bias. If the price meets the stop loss (0.9) without activating the order (0.92), it is recommended to delete the order: some internal changes in the market have not been taken into account.

Fundamental Analysis

Industrial production in Switzerland in Q2 2020 suffered the maximum drop in the past 7 years. Will the USDCHF quotes increase?


Want to get more free analytics? Open Demo Account now to get daily news and analytical materials.


Want to get more free analytics? Open Demo Account now to get daily news and analytical materials.

Author

Dmitry  Lukashov

Dmitry Lukashov

IFC Markets

Dimtry Lukashov is the senior analyst of IFC Markets. He started his professional career in the financial market as a trader interested in stocks and obligations.

More from Dmitry Lukashov
Share:

Editor's Picks

EUR/USD hits two-day highs near 1.1820

EUR/USD picks up pace and reaches two-day tops around 1.1820 at the end of the week. The pair’s move higher comes on the back of renewed weakness in the US Dollar amid growing talk that the Fed could deliver an interest rate cut as early as March. On the docket, the flash US Consumer Sentiment improves to 57.3 in February.

GBP/USD reclaims 1.3600 and above

GBP/USD reverses two straight days of losses, surpassing the key 1.3600 yardstick on Friday. Cable’s rebound comes as the Greenback slips away from two-week highs in response to some profit-taking mood and speculation of Fed rate cuts. In addition, hawkish comments from the BoE’s Pill are also collaborating with the quid’s improvement.

Gold climbs further, focus is back to 45,000

Gold regains upside traction and surpasses the $4,900 mark per troy ounce at the end of the week, shifting its attention to the critical $5,000 region. The move reflects a shift in risk sentiment, driving flows back towards traditional safe haven assets and supporting the yellow metal.

Crypto Today: Bitcoin, Ethereum, XRP rebound amid risk-off, $2.6 billion liquidation wave

Bitcoin edges up above $65,000 at the time of writing on Friday, as dust from the recent macro-triggered sell-off settles. The leading altcoin, Ethereum, hovers above $1,900, but resistance at $2,000 caps the upside. Meanwhile, Ripple has recorded the largest intraday jump among the three assets, up over 10% to $1.35.

Three scenarios for Japanese Yen ahead of snap election

The latest polls point to a dominant win for the ruling bloc at the upcoming Japanese snap election. The larger Sanae Takaichi’s mandate, the more investors fear faster implementation of tax cuts and spending plans. 

XRP rally extends as modest ETF inflows support recovery

Ripple is accelerating its recovery, trading above $1.36 at the time of writing on Friday, as investors adjust their positions following a turbulent week in the broader crypto market. The remittance token is up over 21% from its intraday low of $1.12.