Daily Technical Analysis #S-BABA
Slower revenue growth expectations bearish for Alibaba prices
Alibaba Group Holding Ltd sales growth has decelerated while it beat 2018 fourth quarter sales forecast. Will the Alibaba price continue declining?
Alibaba Group Holding Ltd beat fourth-quarter revenue forecasts two weeks ago: revenue increased 51% for January-March from a year earlier to 93.50 billion yuan ($13.6 billion). Alibaba forecast its revenue for the full fiscal year ending in March 2020 will record a 33% increase on the previous year. However Alibaba’s top-line growth rates have slowed sharply from a few years ago. Core commerce segment accounts for 86% of BABA’s revenue. In the past couple of years, core e-commerce revenue growth has decelerated from 55-54% over year in the first quarter of 2018 financial year to 28% in 2019. The sales growth slowing is happening while most of Alibaba’s new initiatives are still losing money. Slowing revenue growth is bearish for Alibaba stock price
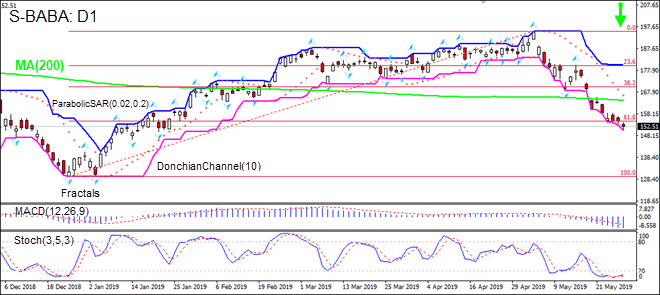
On the daily timeframe the S-BABA: D1 has breached below the 200-day moving average MA(200) and Fibonacci 61.8. This is bearish.
-
The Parabolic indicator gives a sell signal.
-
The Donchian channel indicates downtrend: it is tilted lower.
-
The MACD indicator gives a bearish signal: it is below the signal line and the gap is widening.
-
The Stochastic oscillator is in the oversold zone. this is bullish.
We believe the bearish momentum will continue after the price breaches below the lower boundary of Donchian channel at 150.68. This level can be used as an entry point for placing a pending order to sell. The stop loss can be placed above the fractal high at 180.19. After placing the order, the stop loss is to be moved every day to the next fractal high, following Parabolic signals. Thus, we are changing the expected profit/loss ratio to the breakeven point. If the price meets the stop loss level (180.19) without reaching the order (150.68), we recommend cancelling the order: the market has undergone internal changes which were not taken into account.
Technical Analysis Summary
|
Position |
Sell |
|
Sell stop |
Below 150.68 |
|
Stop loss |
Above 180.19 |
Want to get more free analytics? Open Demo Account now to get daily news and analytical materials.
Want to get more free analytics? Open Demo Account now to get daily news and analytical materials.
Author

Dmitry Lukashov
IFC Markets
Dimtry Lukashov is the senior analyst of IFC Markets. He started his professional career in the financial market as a trader interested in stocks and obligations.


