Technical Analysis NZDCHF : 2018-10-16

The Swiss National Bank is going to keep its ultra-loose monetary policy unchanged
In this review, we will consider the trading instrument the New Zealand dollar against the Swiss franc. Will the NZDCHF rise? The upward movement occurs when the New Zealand dollar quotes rise, and the Swiss franc weakens.
Swiss National Bank President Thomas Jordan said, as he saw no signs of economic "overheating' that could spark inflation. It is appropriate for the SNB to leave Switzerland's ultra-loose monetary policy unchanged, Jordan added. China is New Zealand’s main trading partner. The expected meeting of the presidents of the United States and China at the end of November may reduce the risks in world trade. This is a positive factor for the currency of New Zealand.
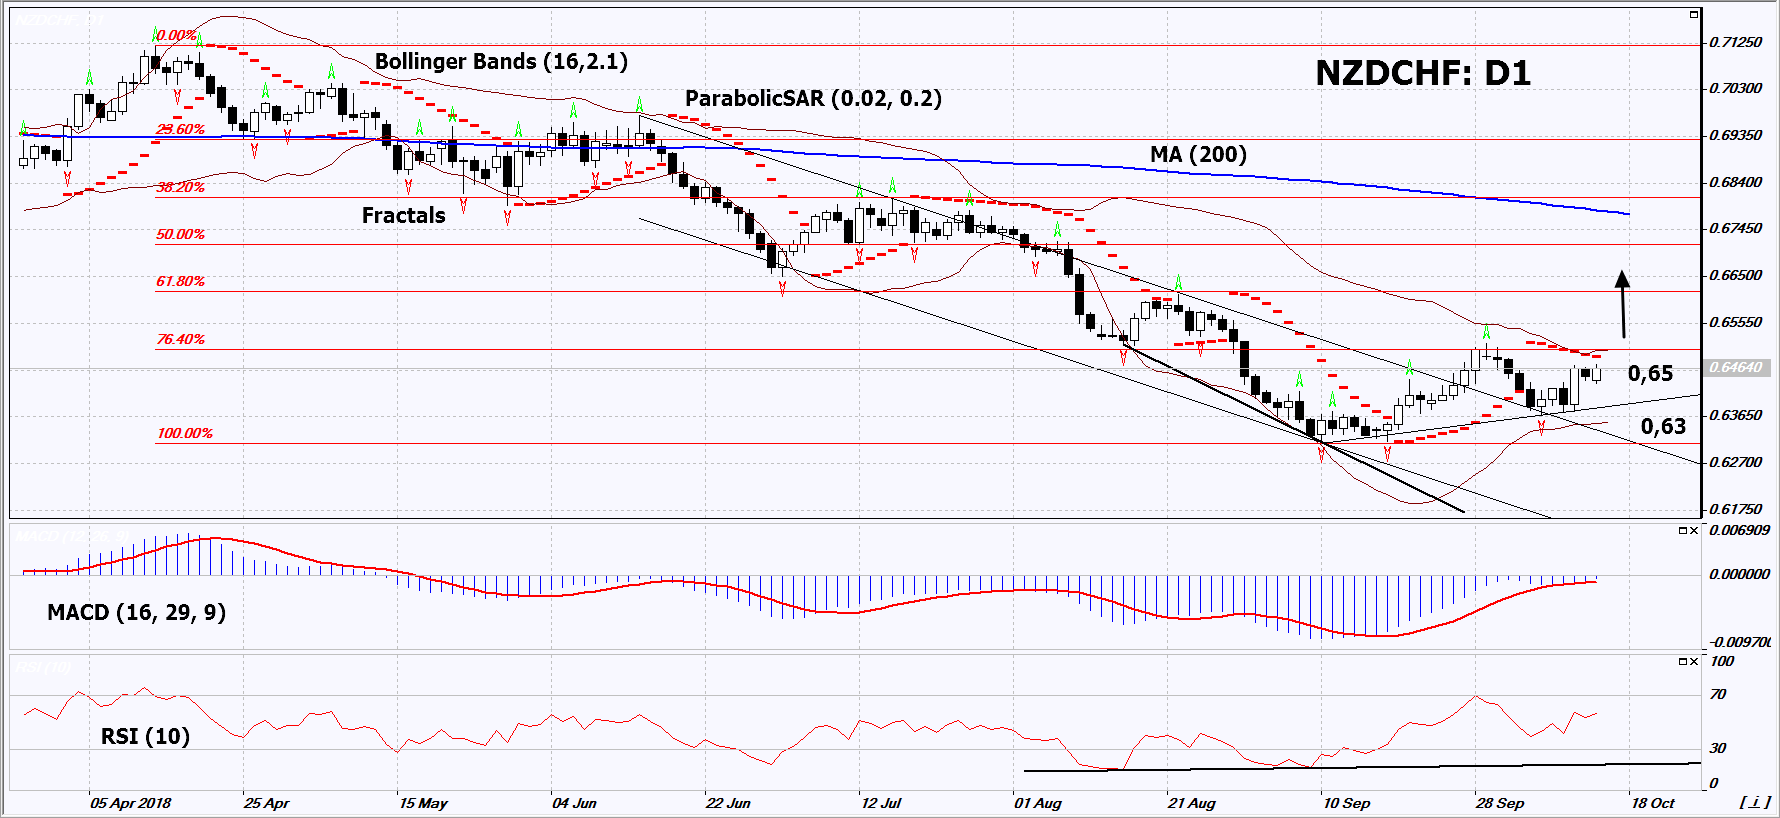
On the daily timeframe, NZDCHF: D1 left the downtrend and is trying to adjust upwards from a 3-year low. The price increase may occur in case of an reduce the risks in global commerce because of the trade war of China and the United States and correction of the Swiss franc.
-
The Parabolic indicator gives a bearish signal. It can be used as an additional resistance, which must be overcome before opening a buy position.
-
The Bollinger bands have widened, which indicates high volatility. The lower band is titled upward
-
The RSI indicator is above 50. There is no a positive divergence.
-
The MACD indicator gives a bullish signal.
The bullish momentum may develop in case NZDCHF exceeds the last fractal highs, upper Bollinger bands and the Parabolic signal at 0,65. This level may serve as an entry point. The initial stop loss may be placed below the 3 last fractal lows, the lower Bollinger band, below the minimum of three years and the Parabolic signal at 0,63. After opening the pending order, we shall move the stop to the next fractal low following the Bollinger and Parabolic signals. Thus, we are changing the potential profit/loss to the breakeven point. More risk-averse traders may switch to the 4-hour chart after the trade and place there a stop loss moving it in the direction of the trade. If the price meets the stop level (0,63) without reaching the order (065), we recommend to close the position: the market sustains internal changes that were not taken into account.
Summary of technical analysis
|
Position |
Buy |
|
Buy stop |
Above 0,65 |
|
Stop loss |
Below 0,63 |
Want to get more free analytics? Open Demo Account now to get daily news and analytical materials.
Want to get more free analytics? Open Demo Account now to get daily news and analytical materials.
Author

Dmitry Lukashov
IFC Markets
Dimtry Lukashov is the senior analyst of IFC Markets. He started his professional career in the financial market as a trader interested in stocks and obligations.


