|

GBP/JPY technical analysis: Hits a snag trying to resume positive trajectory

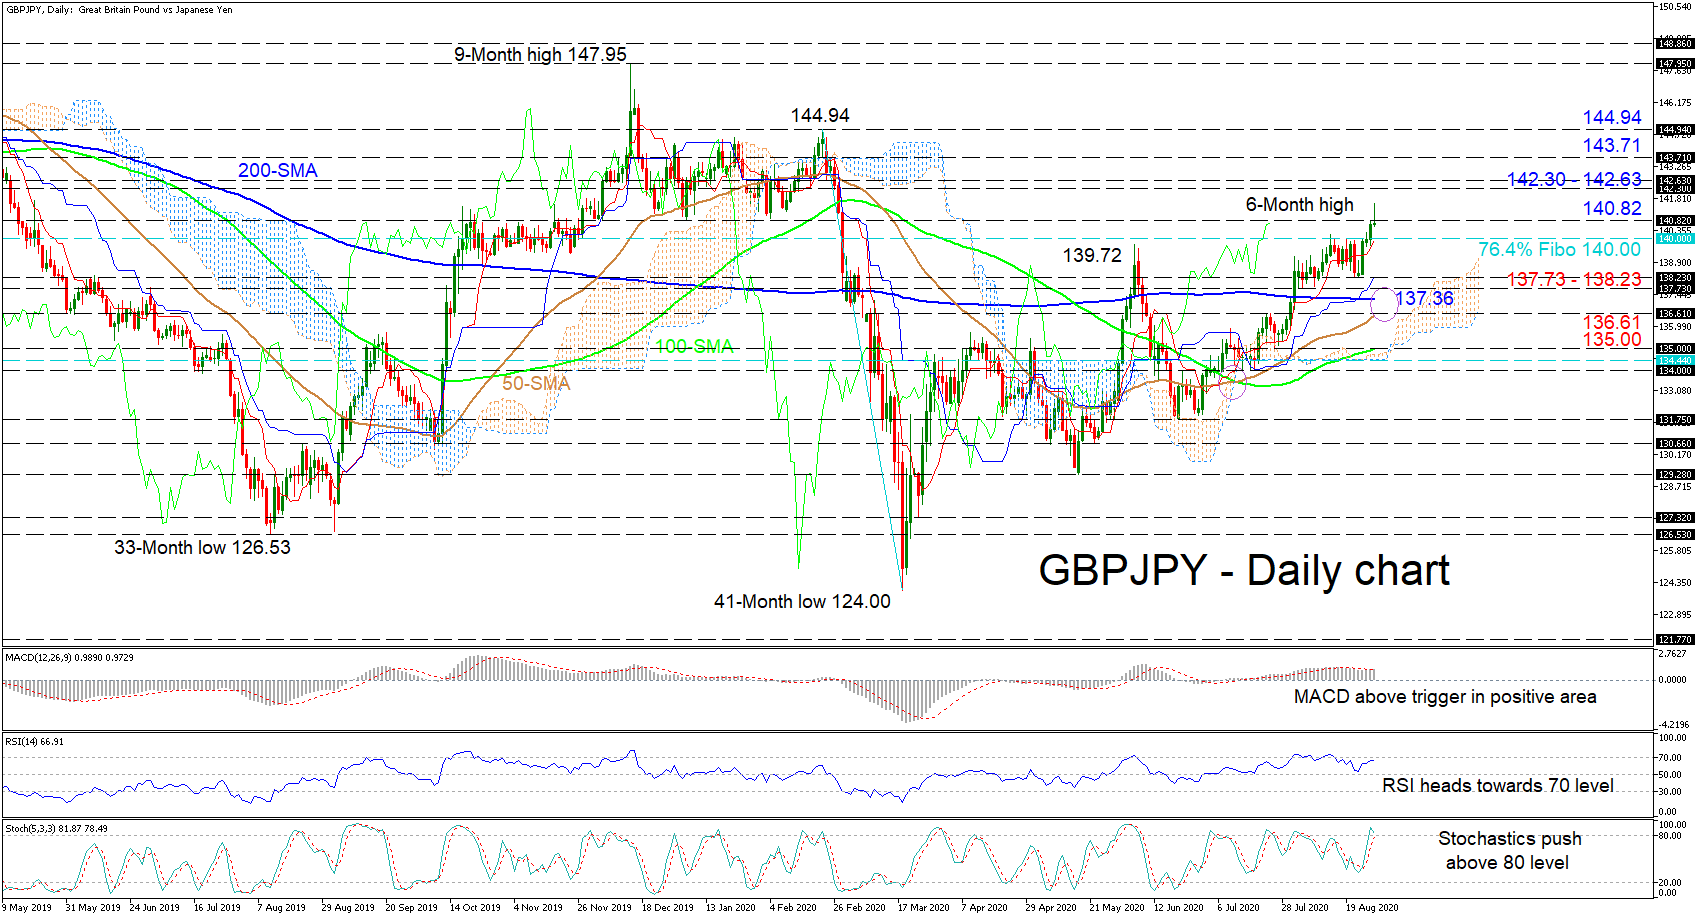
GBPJPY is gaining ground, currently striving to close above 140.82 to clearly resume the climb. The steady incline is also sponsored by the progressing Ichimoku lines and the advancing 50- and 100-day simple moving averages (SMAs). Additionally, an approaching bullish crossover of the 200-day SMA by the 50-day one may fortify the positive outlook.

The short-term oscillators further support an improving picture. The MACD, some distance in the positive area, is above its red signal line, while the RSI is pushing to climb above the 70 mark. The %K line of the stochastic oscillator is stalling in overbought territory but has yet to confirm any bearish tone, thus endorsing further advances.

If the price continues to develop, a band of inside swing lows from 142.30 to 142.63 may deliver initial resistance. If buyers manage to overcome this, the key 143.71 high could then draw traders’ focus. Sustained buying may then be challenged by the 144.94 peak, identified on February 21.

In the event sellers retake control, early support may come at the 140.00 handle, which happens to be the 76.4% Fibonacci retracement of the down leg from 144.94 - 124.00, and where the red Tenkan-sen line is located. Fading further the 137.73 - 138.23 region of lows - where the blue Kijun-sen lies - could attempt to dismiss the retreat. Not far underneath, another tough support zone (137.36 to 136.61), where the nearing bullish crossover of the 200-day SMA is forming, could challenge the descent.

In brief, the short-to-medium term bias is bullish above the 137.73 to 138.23 support section. If the pair plummets below the 100-day SMA at the 135.00 trough, this could spark bearish concerns.

GBPJPY

Author

Anthony Charalambous, CFTe

Anthony Charalambous joined XM in 2019 and specializes in preparing daily technical analysis, using his years of trading experience to provide detailed forecasting for all major asset classes such as forex, indices, commodities and equities.

More from Anthony Charalambous, CFTe
Share:

Editor's Picks

EUR/USD flat lines around 1.1900; looks to US NFP report for fresh directional impetus

The EUR/USD pair is seen oscillating in a narrow trading band around the 1.1900 mark during the Asian session on Wednesday as traders opt to wait for the release of US monthly employment details before placing fresh directional bets.

GBP/USD slips back to daily lows near 1.3640

GBP/USD drops to daily lows near 1.3640 as sellers push harder and the Greenback extends its rebound in the latter part of Tuesday’s session. Looking ahead, the combination of key US releases, including NFP and CPI, alongside important UK data, should keep the pound firmly in focus over the coming days.

Gold awaits US Nonfarm Payrolls data for a sustained upside

Gold remains capped below $5,100 early Wednesday, gathering pace for the US labor data. The US Dollar licks its wounds amid persistent Japanese Yen strength and potential downside risks to the US jobs report. Gold holds above $5,000 amid bullish daily RSI, with eyes on 61.8% Fibo resistance at $5,141.

Ethereum: Whales buy the dip amid rising short bets

Following one of Ethereum's largest weekly drawdowns, whales are slowly returning to action alongside a drop in retail selling pressure. After slightly selling into the decline at the start of the month, whales or wallets with a balance of 10K-100K ETH began buying the dip last Wednesday as prices crashed further. 

Dollar drops and stocks rally: The week of reckoning for US economic data

Following a sizeable move lower in US technology Stocks last week, we have witnessed a meaningful recovery unfold. The USD Index is in a concerning position; the monthly price continues to hold the south channel support.

XRP holds $1.40 amid ETF inflows and stable derivatives market

Ripple trades under pressure, with immediate support at $1.40 holding at the time of writing on Tuesday. A recovery attempt from last week’s sell-off to $1.12 stalled at $1.54 on Friday, leading to limited price action between the current support and the resistance.