Sugar forecasting the rally after Elliott Wave zig zag pattern

We’re going to take a quick look at the Elliott Wave charts of Sugar Futures ( $SB_F) , published in members area of the website. As our members know, we’ve been calling rally in the commodity. We recommended members to avoid selling in any proposed pull back and keep buying the dips in 3,7,11 swings. Recently SB_F made pull back that has unfolded as Elliott Wave Zig Zag pattern . In the further text we are going to explain the Elliott Wave Pattern and Forecast
Before we take a look at the real market example, let’s explain Elliott Wave Zigzag.
Elliott Wave Zigzag is the most popular corrective pattern in Elliott Wave theory . It’s made of 3 swings which have 5-3-5 inner structure. Inner swings are labeled as A,B,C where A =5 waves, B=3 waves and C=5 waves. That means A and C can be either impulsive waves or diagonals. (Leading Diagonal in case of wave A or Ending in case of wave C) . Waves A and C must meet all conditions of being 5 wave structure, such as: having RSI divergency between wave subdivisions, ideal Fibonacci extensions and ideal retracements.
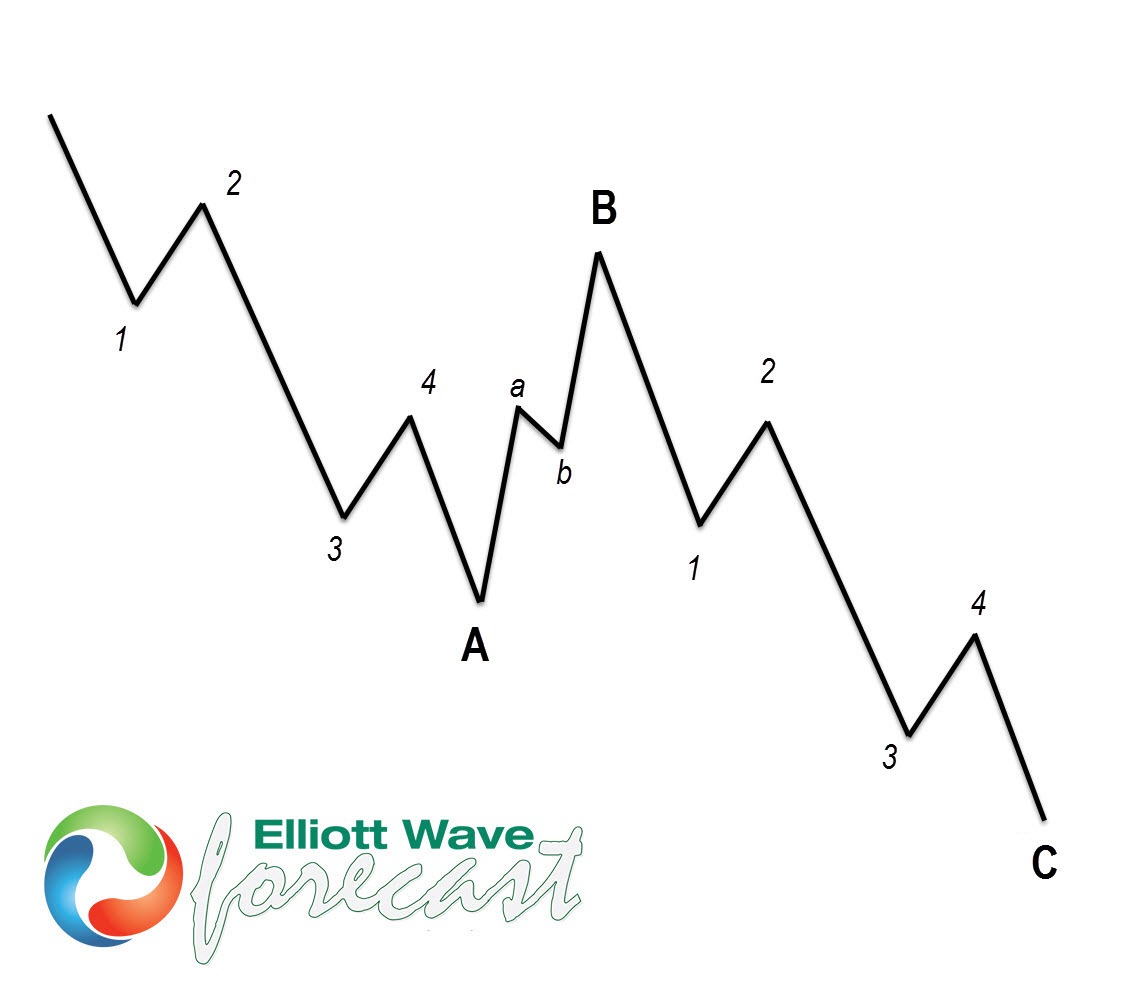
Now let’s take a look what Elliott Wave Zig Zag looks like in real market example.
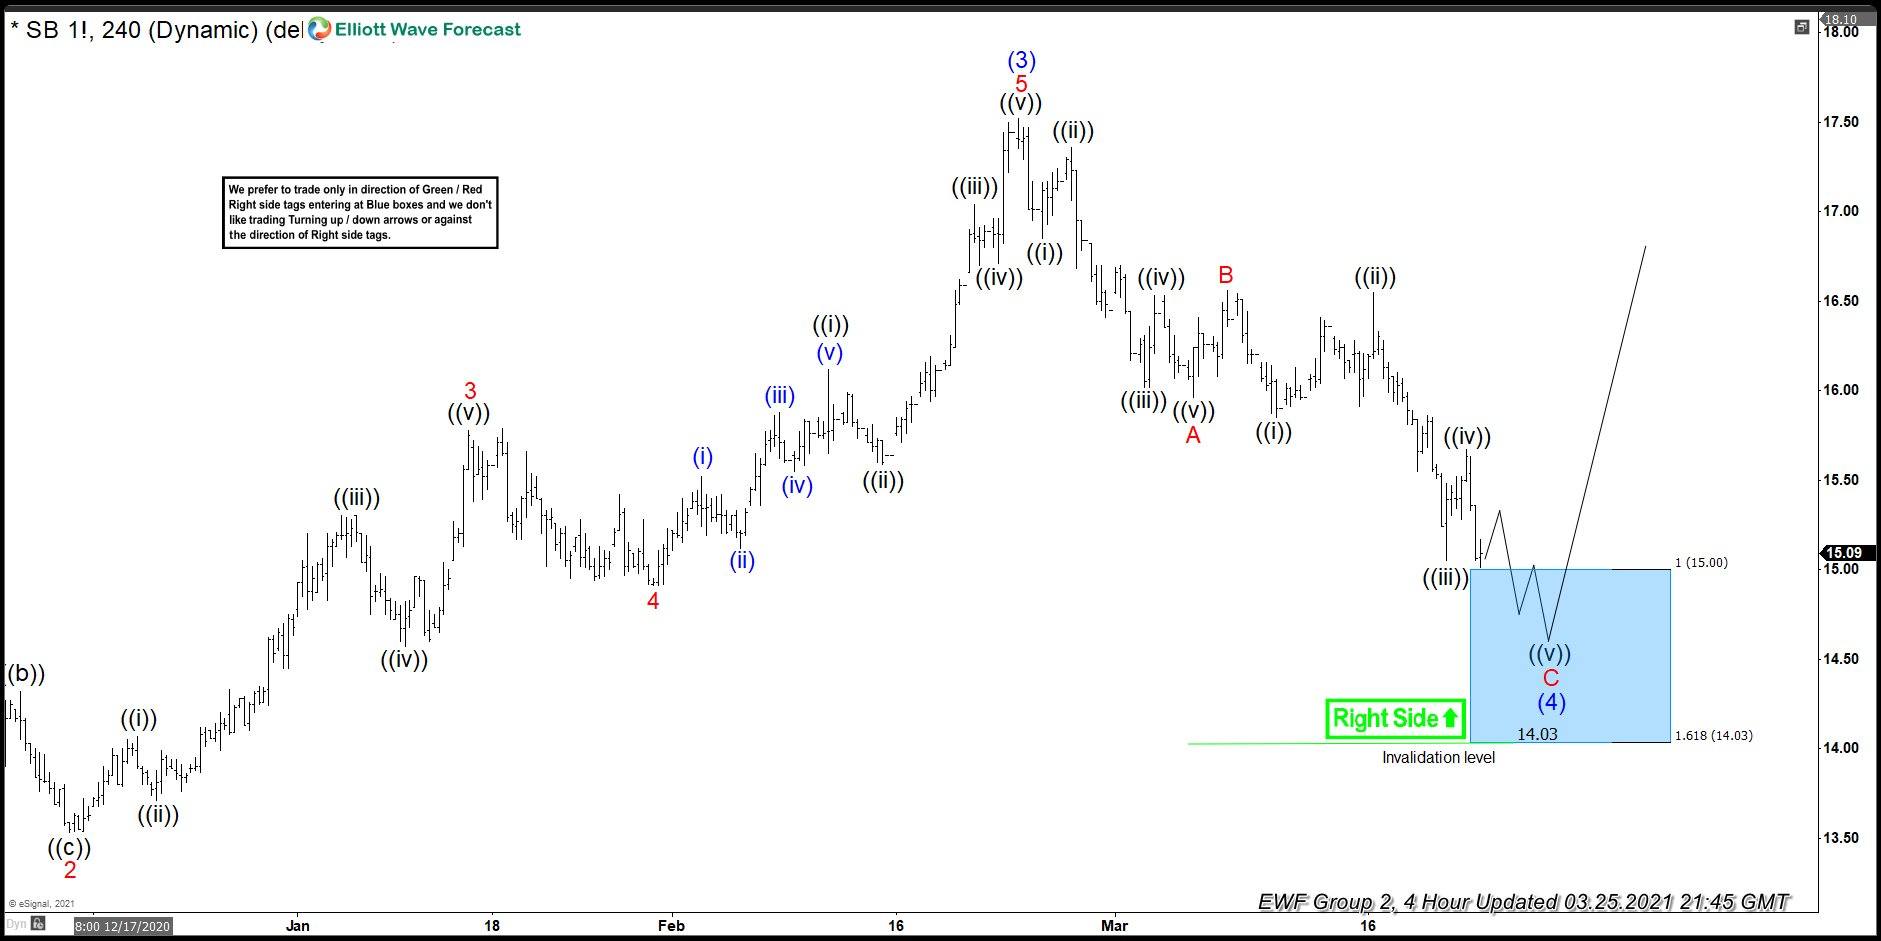
Sugar Futures ($SB_F) Elliott Wave 4 Hour Chart 3.25.2021
Right side remains in the favor of commodity. Sugar Futures remains buy in a dips. Current view suggests (4) blue pull back is unfolding as Elliott Wave Zig Zag pattern with inner labeling: ABC red. We can see that wave A red shows impulsive 5 waves structures . C red leg also shows 5 waves at the moment, however we believe more short term weakness can be seen within blue box area 15.00-14.03. We don’t recommend selling it and favor the long side from the mentioned zone. As the main trend is bullish we expect buyers to appear for 3 waves bounce at least. As our members know, Blue Boxes are no enemy areas, giving us 85% chance to get a bounce.
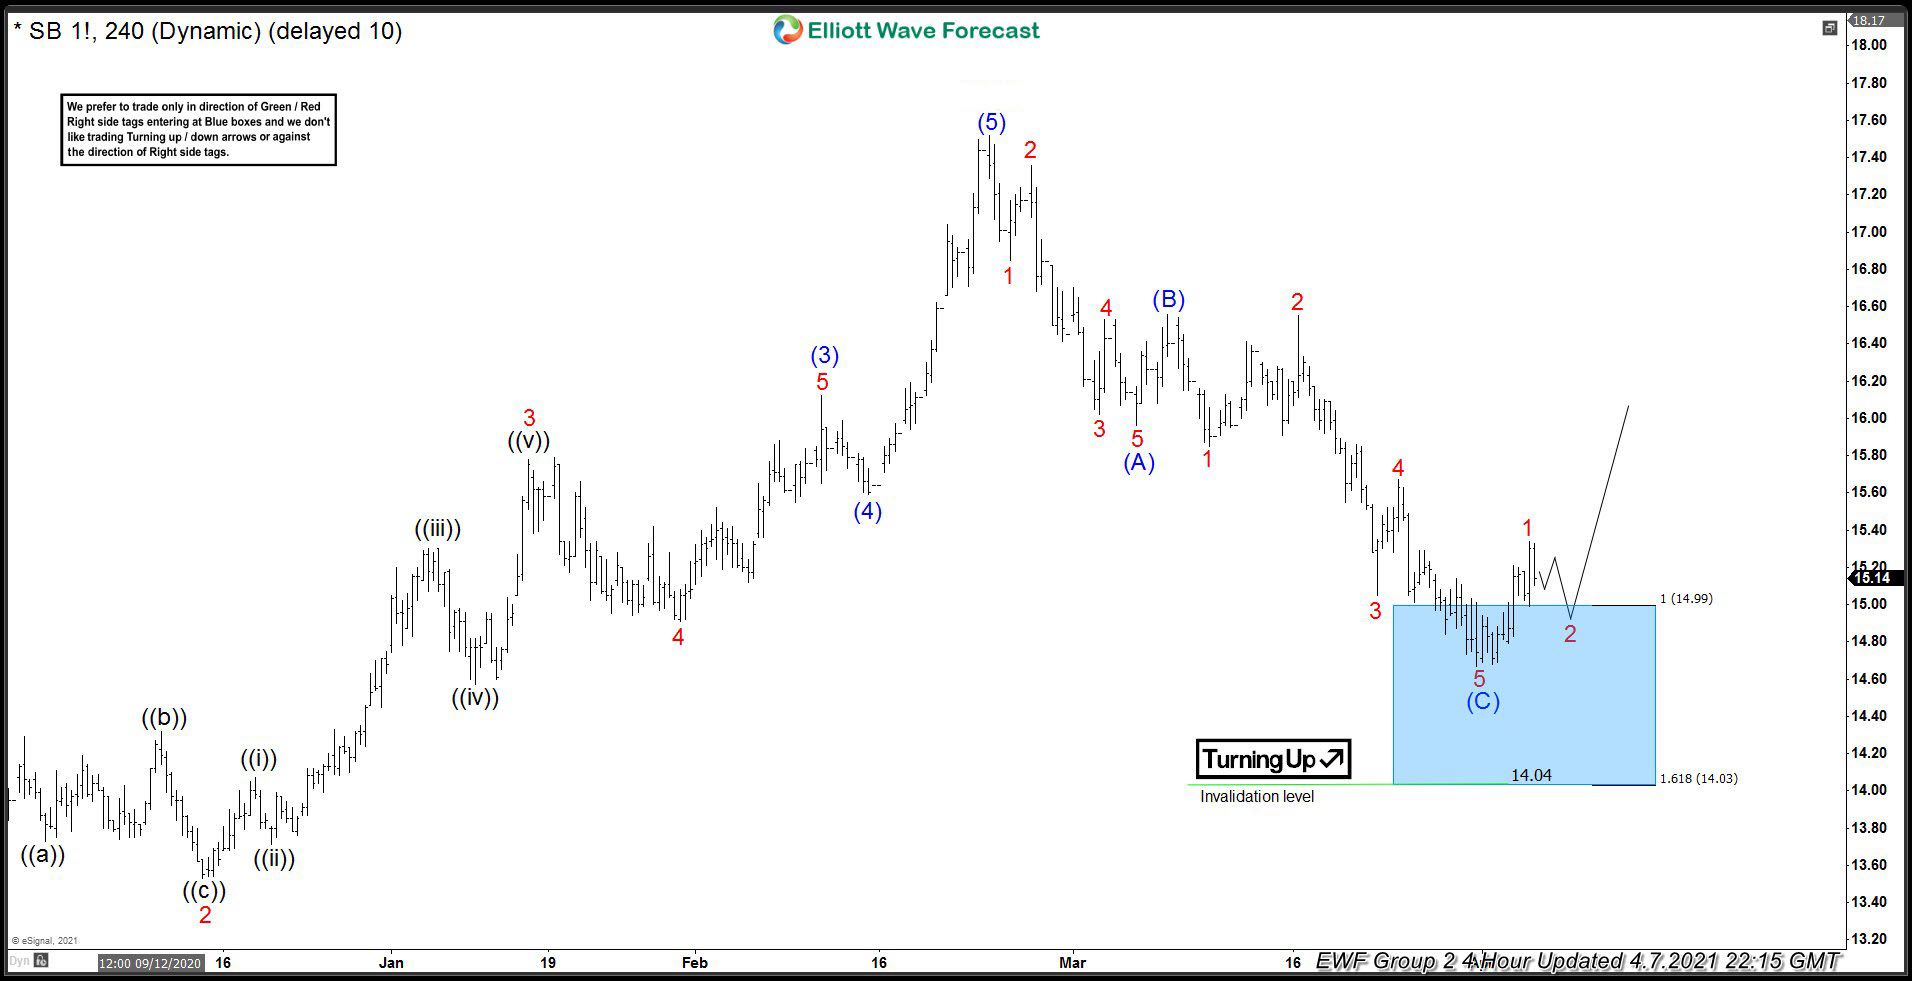
Sugar Futures ($SB_F) Elliott Wave 4 hour chart 4.7.2021
The commodity made more short term weakness within the blue box as expected. Buyers appeared there and we are getting reaction. We believe pull back is completed at 14.67 low, however still need to see further separation from the latest low to confirm cycle from the peak is completed.
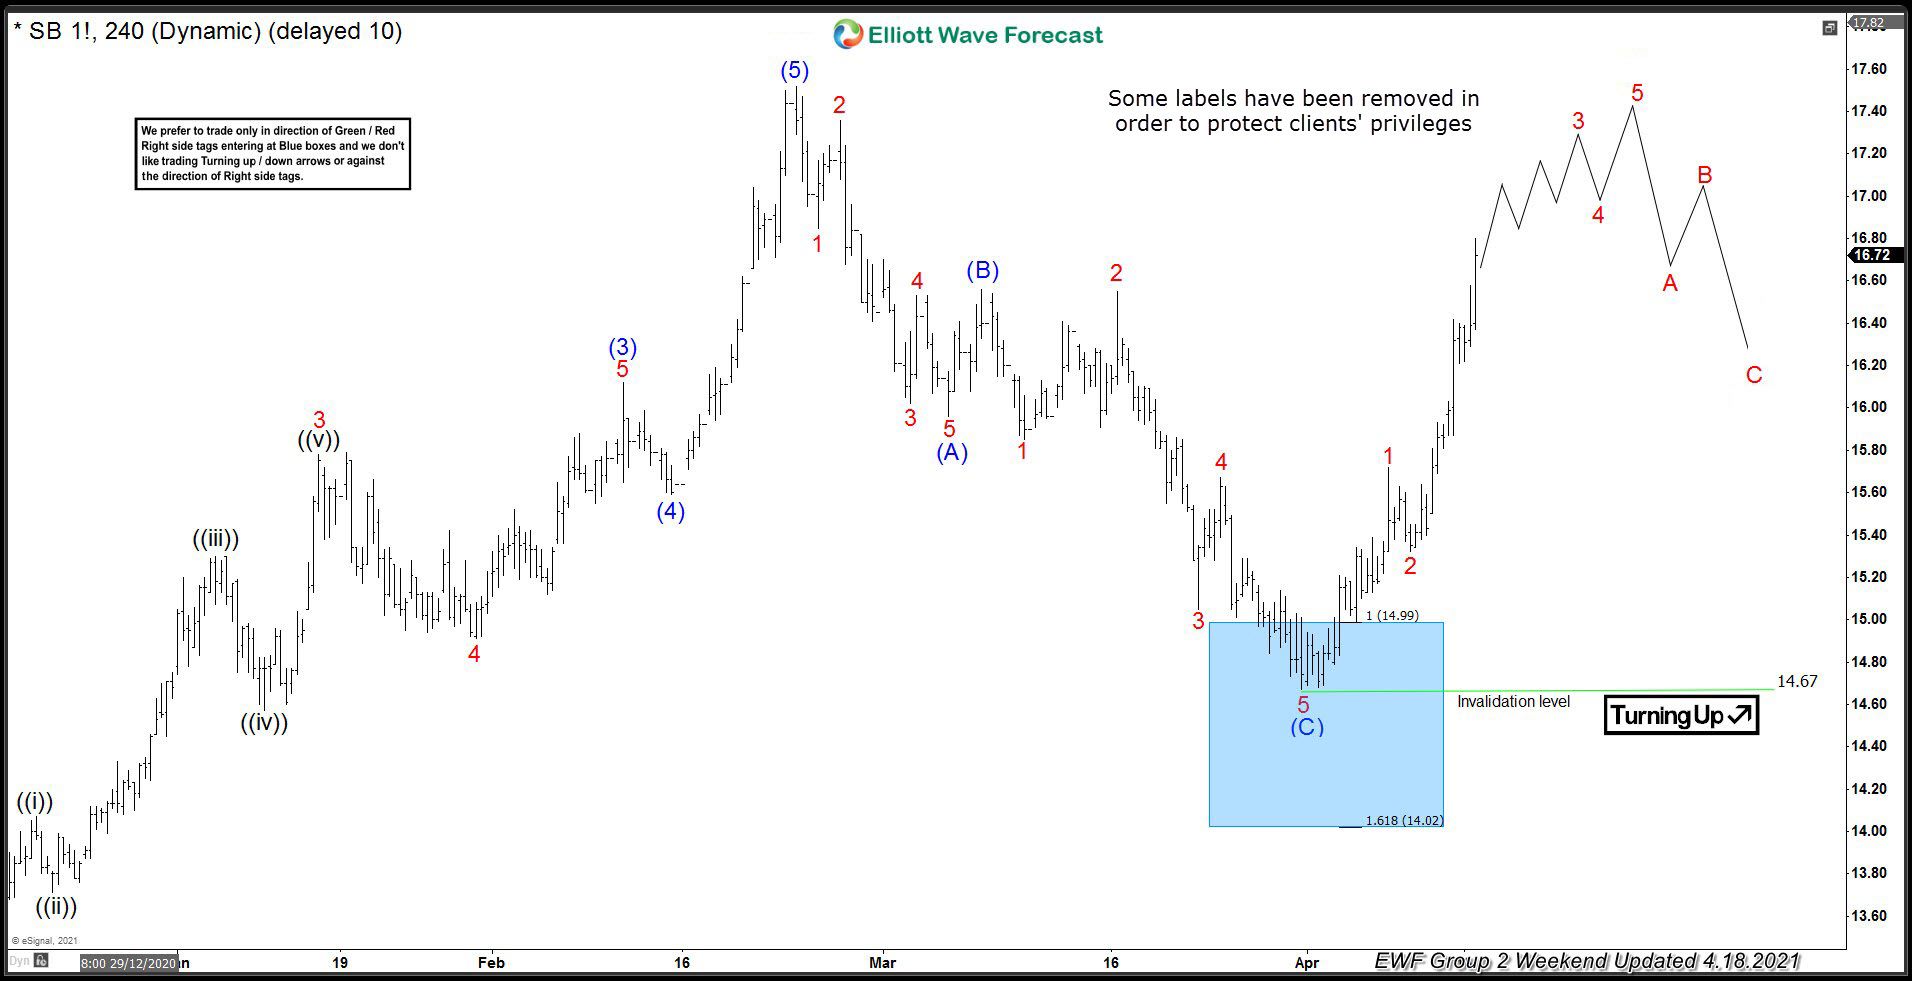
Sugar Futures ($SB_F) Elliott Wave 4 hour chart 4.7.2021
14.67 low held nicely and the commodity made further extension higher as we expected. Cycle from the 14.67 low can be unfolding as 5 waves structure. We would like to see break above April peak to confirm next leg up is in progress.
Keep in mind that market is dynamic and presented view could have changed in the mean time. Best instruments to trade are those having incomplete bullish or bearish swings sequences. We put them in Sequence Report and best among them are shown in the Live Trading Room. You can check most recent charts in the membership area of the site.
Author

Elliott Wave Forecast Team
ElliottWave-Forecast.com


