Stocks at Last Year’s Record High
Stocks retraced some of their Tuesday’s run-up yesterday, as investors took short-term profits off the table. The S&P 500got very close to the September 21st record high. Will it reach the new all-time high?
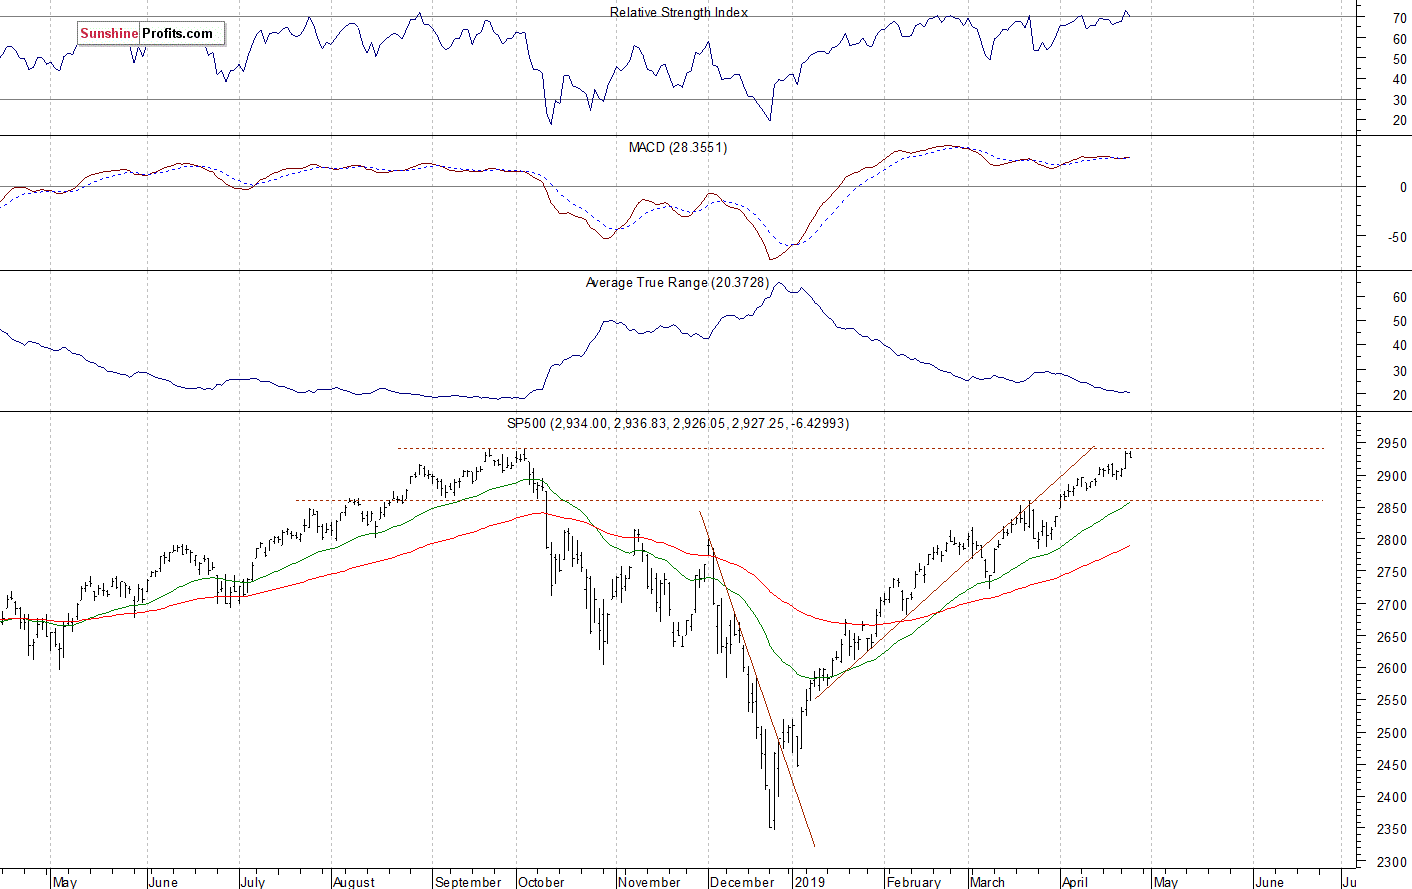
The U.S. stock market indexeslost 0.2% on Wednesday, as investors took some short-term profits off the table following Tuesday’s rally. The S&P 500 index retraced almost all of its medium-term downward correction of 20.2%. The broad stock market's gauge is now just 0.5% below September the 21st record high of 2,940.91. Both the Dow Jones Industrial Average and the Nasdaq Compositelost 0.2%on Wednesday.
The nearest important resistance level of the S&P 500 index isat around 2,940, marked by the mentioned record high. On the other hand, the support level isnow at 2,920, marked by the recent resistance level. The support level is also at 2,900.
The broad stock market retraced all of its December sell-off and it broke above the medium-term resistance level of around 2,900 recently. So is it still just a correction or a new medium-term uptrend? We may see an attempt at getting back to the record high. There have been no confirmed negative medium-termsignals so far. The index got very close to its last October all-time high, as we can see on the daily chart:
Mixed Expectations, Will Uptrend Continue?
Expectations before the opening of today's trading session are mixed, because the index futures contracts trade between -0.5% and +0.2%vs. their Wednesday’s closing prices. The European stock market indexes have lost 0.1-0.4% so far. Investors will wait for some economic data announcements: Durable Goods Orders, Unemployment Claims at 8:30 a.m. They will also wait for more quarterly corporate earnings releases. Stocks will likelyextend their short-term consolidation along the last year’s record high. There have been no confirmed negative signals so far. However, we can see some short-term technical overbought conditions.
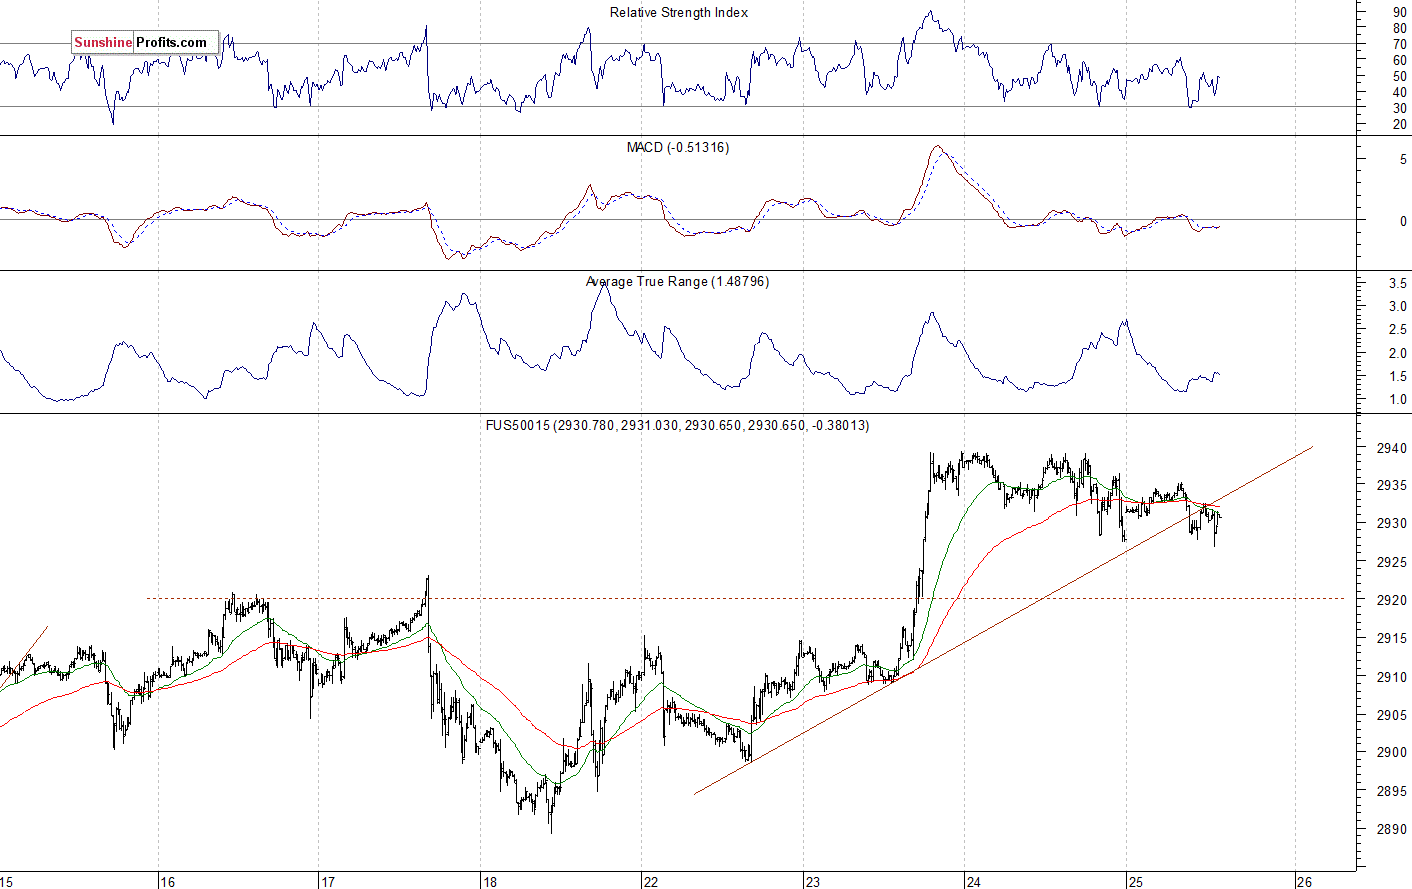
The S&P 500 futures contract trades within an intraday consolidation, as it remains close to the record high. The nearest important resistance level is at around 2,940. On the other hand, the support level is at 2,925-2,930, among others. The futures contract is slightly below its recent upward trend line this morning, as the 15-minute chart shows:
Nasdaq at New Record High
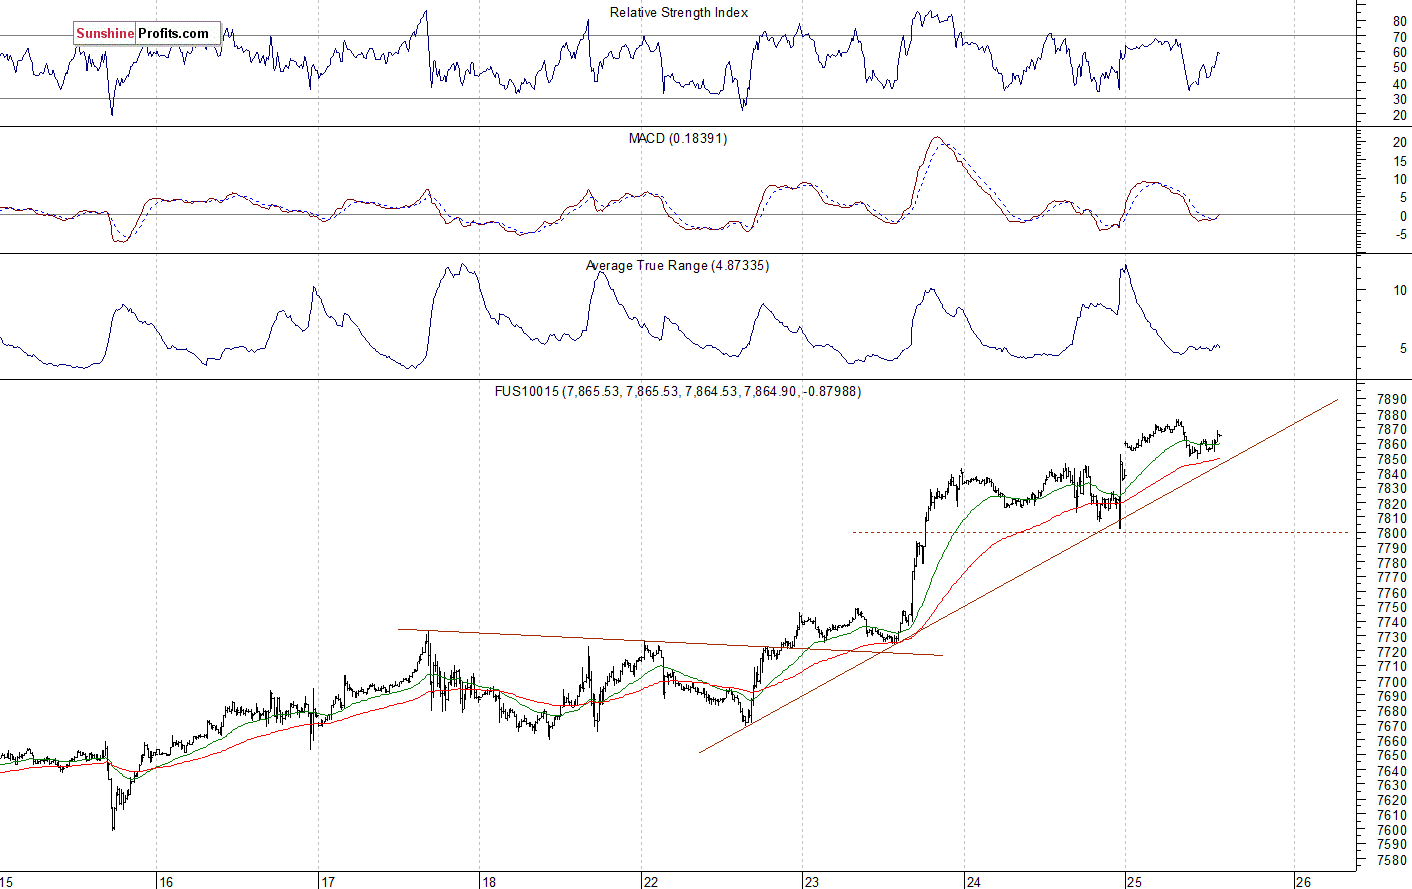
The technology Nasdaq 100 futures contract trades along the new record high. The market extended it uptrend yesterday after-hours, as investors reacted to the quarterly earnings releases from Facebook and Microsoft. The tech stocks’ gauge got closer to the 7,900 mark. The nearest important resistance level is at around 7,900-8,000. On the other hand, the support level is now at 7,800. The Nasdaq futures contractremains above the short-term upward trend line, as we can see on the 15-minute chart:
Big Cap Tech Stocks Extend Their Gains
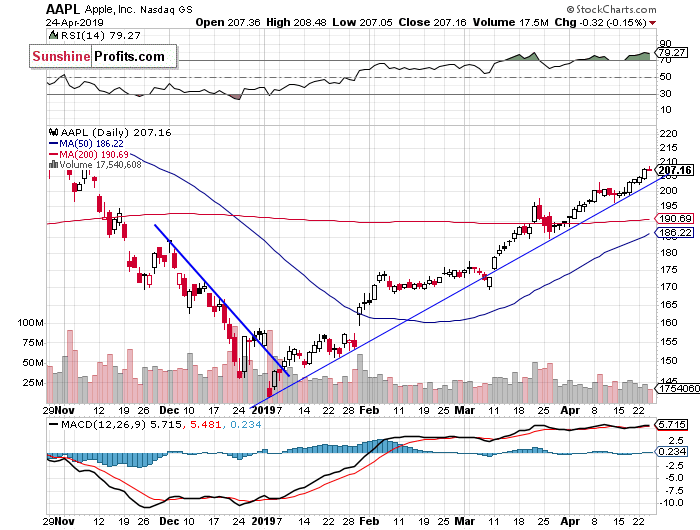
Let's take a look at the Apple, Inc. stock (AAPL) daily chart (chart courtesy of http://stockcharts.com). The stock accelerated its uptrend recentlyand it broke above the $200 level.Yesterday the marketreached another new medium-term high, but then it closed slightly lower:
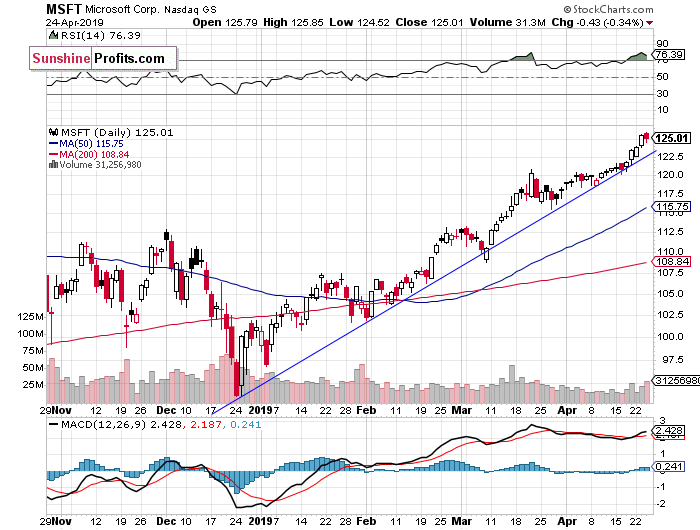
Now let's take a look at the daily chart of Microsoft Corp. (MSFT). The stock reachedyet anothernew record highyesterday. The market continues to trade abovethe three-month-long upward trend line. Today it will likely accelerate the uptrend following yesterday’s better-than-expected quarterly earnings release. Then we may see a short-term topping pattern and some profit-taking action:
Dow Jones Going Sideways
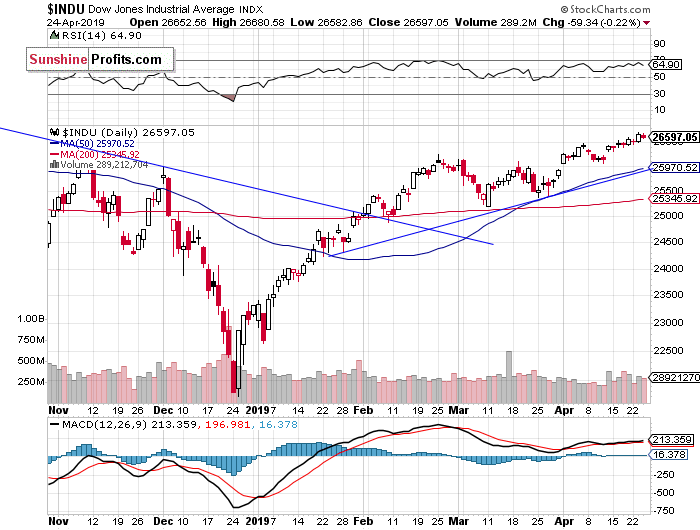
The Dow Jones Industrial Averagebroke above its February local highrecently and it extendedthe medium-term uptrend. The next resistance level is at around 26,800-27,000, marked by the last year’s topping pattern and the record high of 26,951.8. On Tuesday the blue-chip stocks’ gauge reached another new medium-term high. There have been no confirmed negative signals so far. However, we can see some negative technical divergences:
Nikkei Relatively Weaker
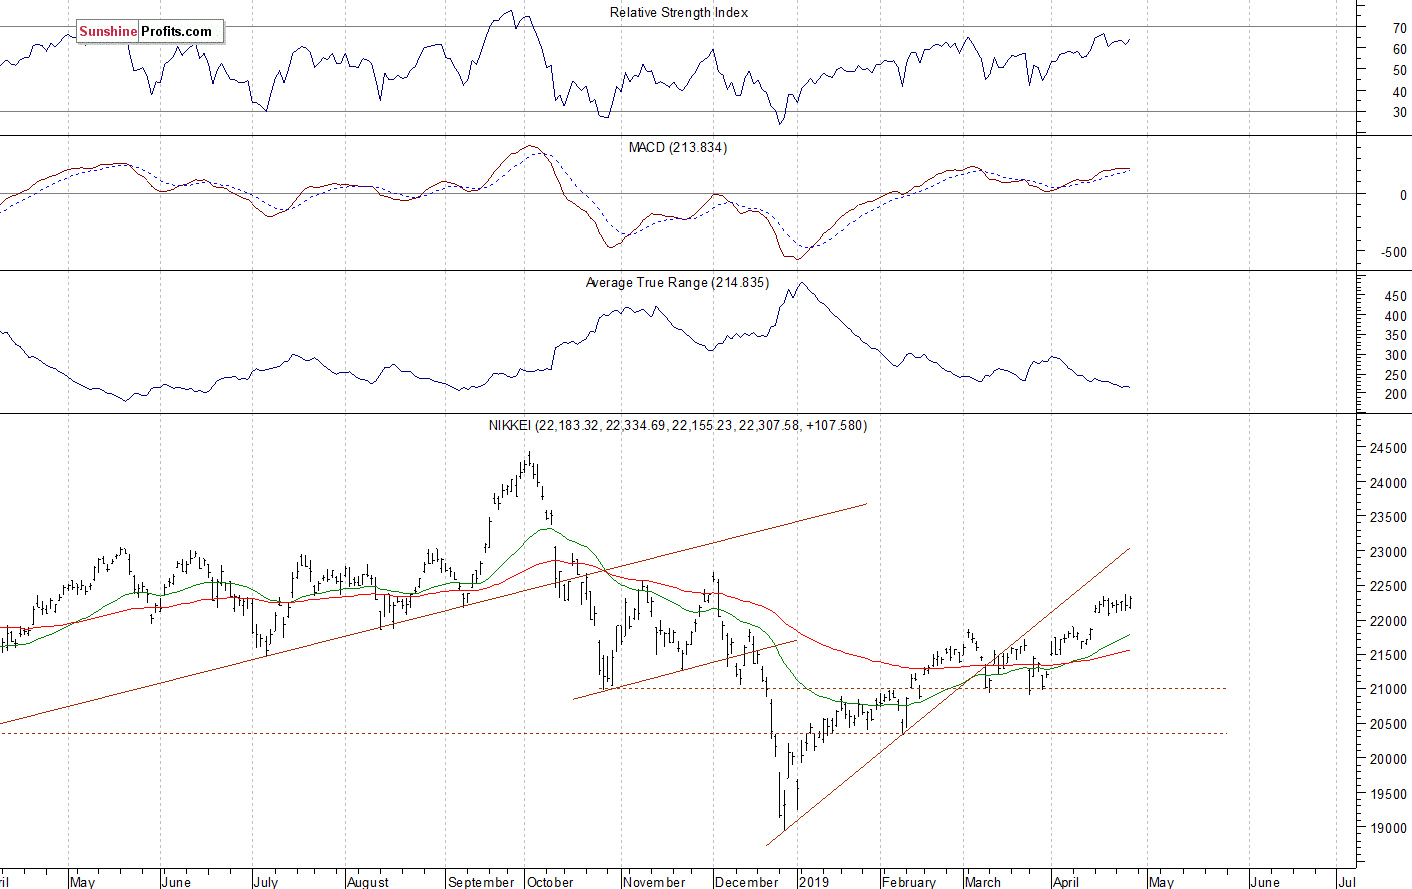
Let's take a look at the Japanese Nikkei 225 index. It accelerated the downtrend in late December, as it fell slightly below the 19,000 level. Then it was retracing the downtrend for two months. In March the market went sideways. Recently it broke above the 22,000 mark. The Japanese stock market remains relatively weak, as it continues to trade well below its last year’s local highs:
The S&P 500 index broke above its short-term consolidation on Tuesday and it got very close to the record high of 2,940.91. The broad stock market may reach new record highs, as investors’ sentiment remains very bullish ahead of quarterly corporate earnings releases. However, we can see short-term technical overbought conditions that may lead to a downward correction at some point.
Concluding, the S&P 500 index will likely open virtually flat today.We may seean attempt at breaking above the last year’s record high. Investors will await more quarterly corporate earnings releases.
Want free follow-ups to the above article and details not available to 99%+ investors? Sign up to our free newsletter today!
Author

Paul Rejczak
Sunshine Profits
Paul Rejczak is a stock market strategist who has been known for the quality of his technical and fundamental analysis since the late nineties.


