Speculators Rule The Market

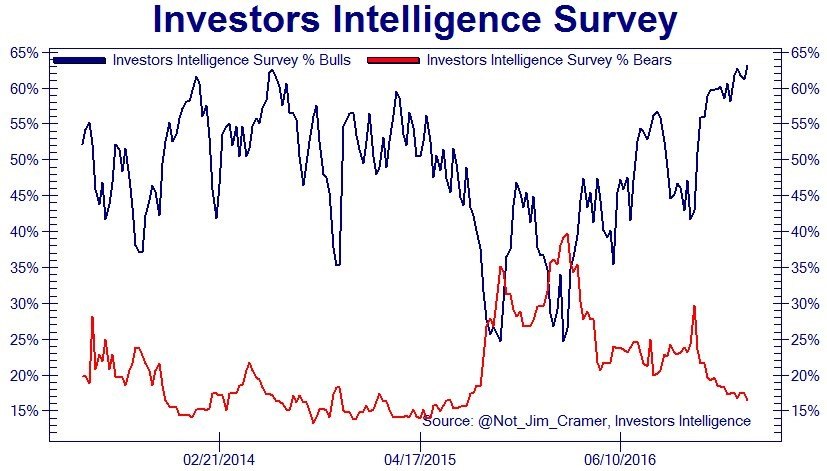
There is a distinct possibility we are closer to the end of this bubble stock market than most expect. It’s difficult to determine where stocks are going when they are priced based on the fundamentals. When they are increasing based on sentiment alone, it becomes nearly impossible. Since sentiment is very important to this market, I put the latest Investor’s Intelligence Survey below. 63.1% of the investors surveyed were bullish, which is the highest rating since 1987. I don’t understand why the retail investors I talk to are willing to invest at such expensive valuations. Calling the latest speculators retail investors is too much of a compliment. The only thing to call the electrician I know buying stock in DryShips is a reckless speculator.
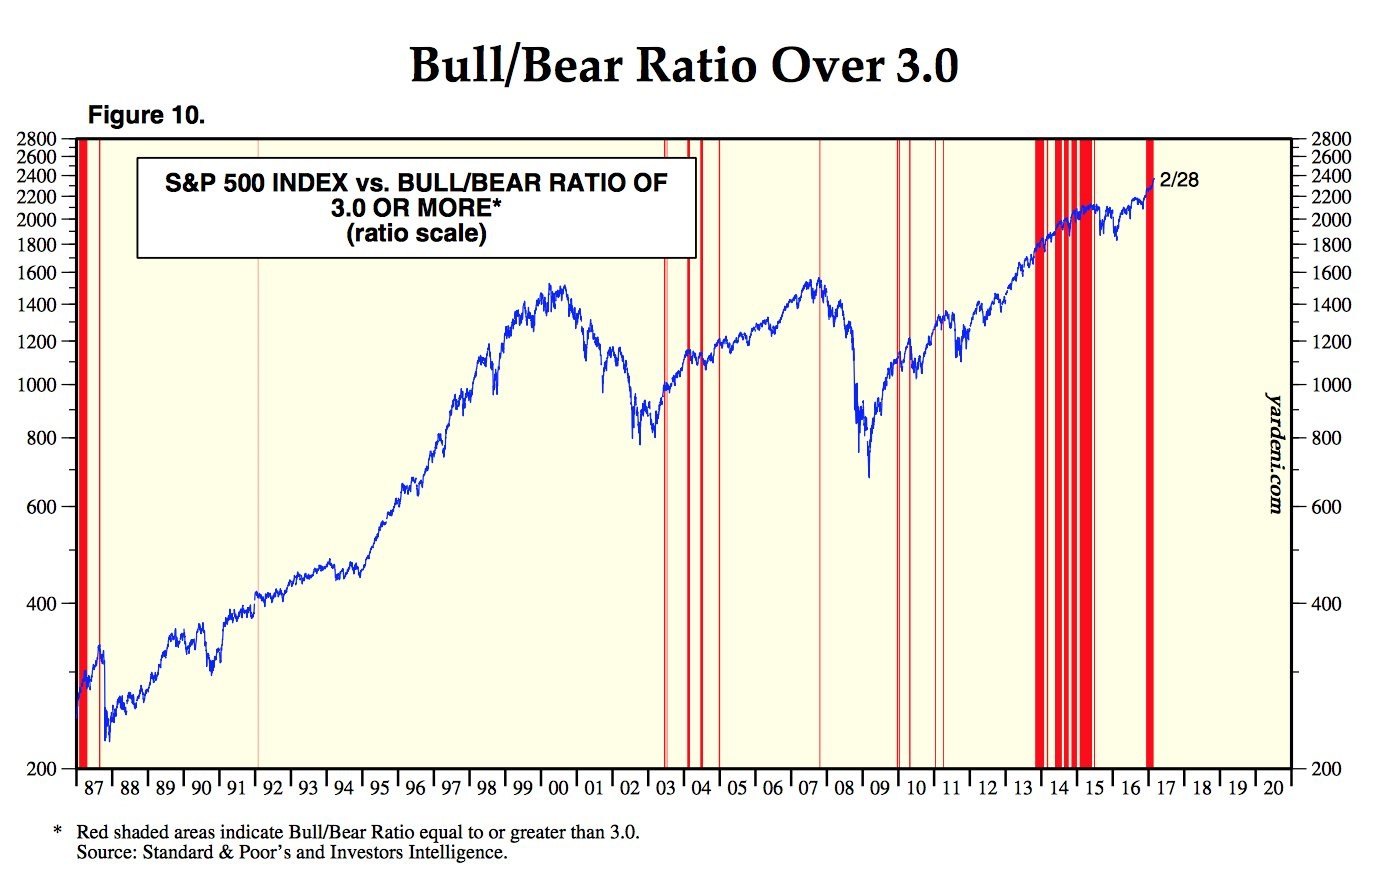
Another way to look at the reckless speculation in stocks is the bull to bear ratio. The chart below has a red line through the S&P 500 when the bull to bear ratio is above 3.0. The optimism is much greater than the beginning of the last bull market in 2003 as there are more red lines.
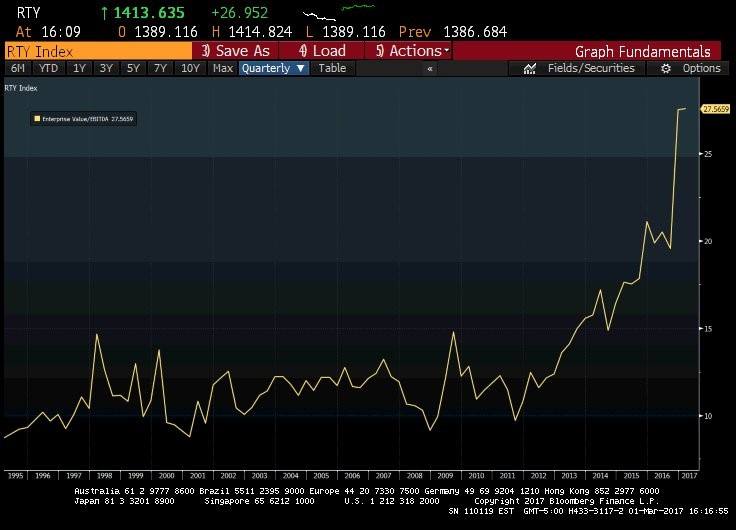
I don’t think speculators are looking at the chart below. It shows the Russell 2000’s enterprise value to EBITDA. It’s nearly double the bubble valuations of the late 1990s because the tech bubble was centered around a few technology stocks. This bubble is more broad-based. This type of chart is why I have said we are living in historic times.
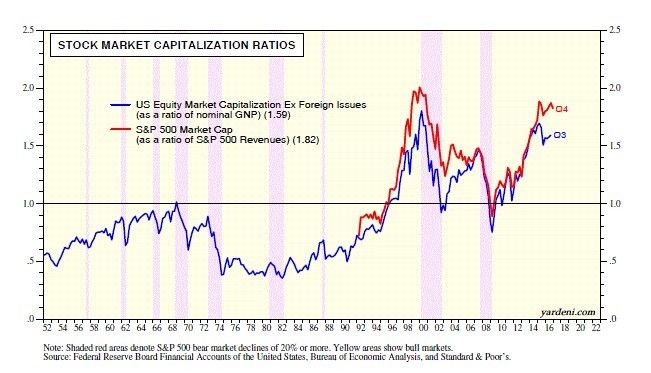
Other ways to measure the stock market are seen below. The U.S. equity market excluding foreign issues as a ratio of nominal GNP is near the bubble peak of the late 1990s. The S&P 500 market cap as a ratio to S&P 500 revenues is also near the high seen in the late 1990s. Bulls do not care about valuations. It’s why they buy stock in Snap which has more losses than revenues (absolute value).
The Fed is preparing to raise rates in March because inflation has been increasing. A big reason why inflation has moved higher is the base effect of oil prices rising. The Fed has been giving itself credit for a mission accomplished as inflation is approaching its 2% target. Inflation’s rise was caused by Trump’s election and oil price increases. This means the Fed’s policies to create inflation didn’t work. The only inflation it created was higher stock and bond prices. It’s dangerous that the Fed could be so wrong about its policies. The three valuation metrics I showed above are all at or near record highs because of the Fed’s balance sheet expansion shown in the chart below. The stock market is whistling past the graveyard as the Fed is threatening to take away the punch bowl.
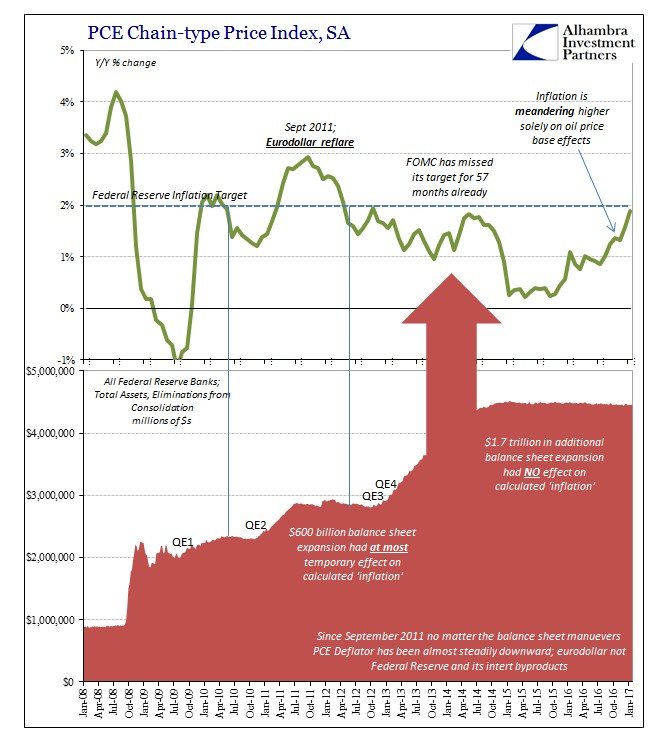
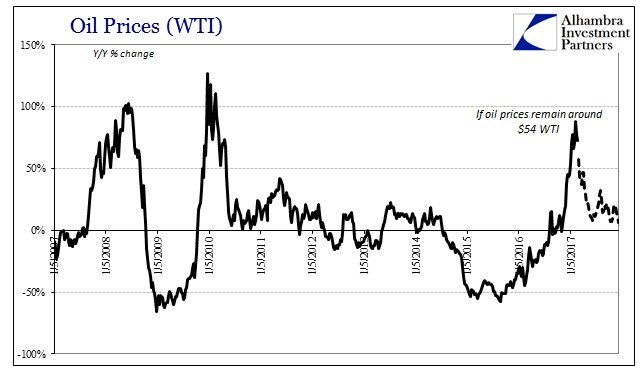
It would be interesting to see the Fed raising rates in a declining inflation environment. Maybe the Fed will again take the credit for the declining inflation even though it will be caused by the base effects of oil prices. If oil prices remain at $54, it will stop pushing up inflation. The dotted lines in the chart below show the future base effects with oil at $54. I think oil prices will fall because of the level of inventories and speculation by traders, but the crash to the high $30s still hasn’t happened.
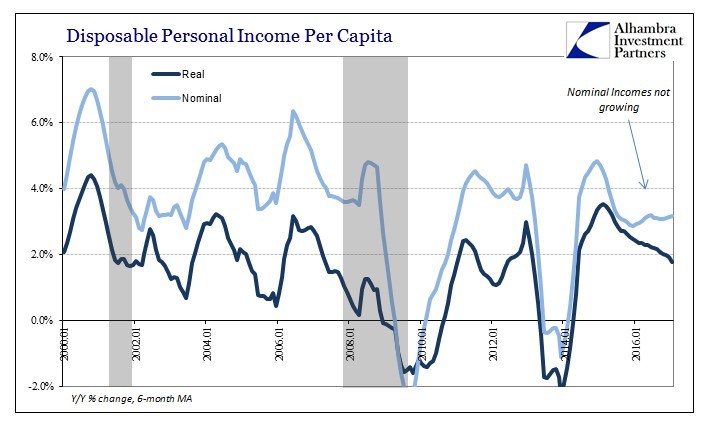
The chart below shows the real and nominal disposable income per capita. It is an example of hard data not agreeing with the survey data. The consumer confidence survey is at cycle highs while the real and nominal disposable income per capita are decelerating. The consumer must be anticipating a big income tax cut. There were two Bush tax cuts. The first phase was in 2001 and the second phase was in 2003. You can see the two bumps in disposable income soon afterward in the chart below. It’s questionable whether a transitory increase in disposable income warrants such a large increase in optimism. The effects of the tax cuts are being overexaggerated.
The effects of tax cuts were overexaggerated in 2001 by the Heritage Foundation. In 2001 the Heritage Foundation stated “Under President Bush's plan… the national debt would effectively be paid off by FY 2010.” At the end of 2010, the debt was $14 trillion. Saying the benefits of the tax cuts were overexaggerated is an understatement. Instead of paying off the debt, it ballooned higher. The fine print of the claim by the Heritage Foundation said $818 billion of the debt couldn’t be paid off because it is made up of long-term debt which isn’t available for redemption. I’ll also assume the Heritage Foundation didn’t know about the Middle Eastern wars which cost $4 trillion. Therefore, the mathematical error made was $9 trillion. I’m in favor of tax cuts, but it’s silly to assume they act as pixie dust and cure all the ailments the economy faces.
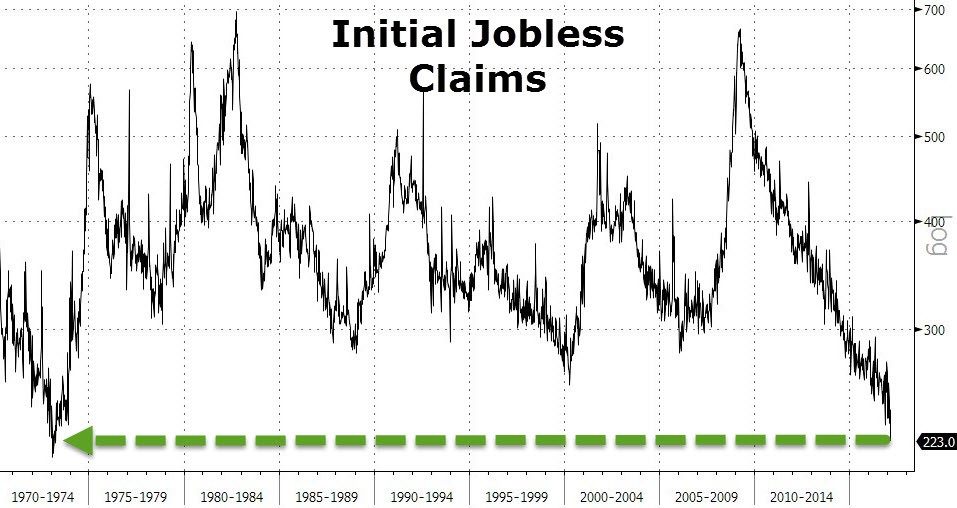
The final chart I have is the initial jobless claims. On Thursday, the jobless claims fell 19,000 to 223,000. It’s the lowest rate since March 1973 and the lowest ever when considering the workforce population growth. We are in the longest period of declining jobless claims ever. It’s usually bearish for jobless claims to be low because it represents the calm before the storm. Bulls are betting the longest streak will get even longer.
Conclusion
To summarize the reckless speculative phase of this bull market, I will review the abhorrent details of the Snap IPO. The firm has negative $676 million in free cash flow. The co-founders only own 19% of the shares, but because they have super-voting rights, they will control all the firm’s major decisions. It’s amazing that the investment banks underwriting this IPO allowed this to happen. In the next 3 to 4 years there will be 270 million new shares issued which represents a massive dilution for current shareholders as there’s currently 1.187 billion shares outstanding. CEO Evan Spiegel will receive 37 million shares with no performance requirements. At Thursday’s close, that is $906 million. Snap picked a perfect time to do its IPO. We are near the end of this bubble period.
Don Kaufman: Trade small and Live to trade another day at Theotrade.
Author

TheoTrade Analysis Team
TheoTrade, LLC
Don Kaufman, Co-Founder, Chief Derivatives Instructor (Trader Stocks, Options, Futures) Don is one of the industry's leading financial strategists and educational authorities.


