SP500 "Volatility"
We are entering the summer period where interest and action in the markets and financials in general usually dissipates somewhat. We will continue with the weekly blog posts but the posts will be shorter than usual with a couple of weekends off. I will get back to a normal post in late August. Also, I cancelled the comments section due to foul language.
The biggest astrological event was the Solar eclipse and the aspects around it, on July 2, 2019. Solar eclipses often coincide with significant earthquakes. In this case there were significant earthquakes in California and west coast of Canada. The following dates are all +- 3 td’s.
July 15 - Saturn parallel Pluto
If the planets are both North or both South of the ecliptic, the parallel aspect is read as a conjunction. If they are the same declination but one is North and one is South, then the contra-parallel is read as a 180 degree opposition.
Saturn is the planet of security, protectionism, tradition, convention, conservative (rear vision) thinking, economy, cost cutting, lower prices, business slowdowns, recession, poverty, farmers, mining, coal, the weather, storms, floods, droughts, disease, fear, suffering and me-first.
Pluto is the planet of drastic situations, cooperation, coercion, groups, gangs, crowds, mobs, human rights groups, human welfare workers, dictators, criminals, crime networks, insidious crimes, subtle cunning, inversion and misinformation.
Volatility of world events continues with Iran lining up against the US and the UK.
There will be a number of aspects involving Venus From July 16 through the end of the month. Among other things aspects to Venus may involve a countries currency. This may drive up crude and increase the price of precious metals.
Following is the Sagittarius Rising astrological chart for the U.S. There are a number of charts.In the third house we have transiting Neptune conjunct the Uranian point Vulcanus Very explosive. When we look for changes in trend we find Mercury turning Direct on July 31. This should indicate a change in trend centered around the Mercury date. +- 3 tds. Mercury will turn direct in Cancer, a cardinal Water sign. Mercury turning direct will arrive July 31 the same date as the FED rate decision.
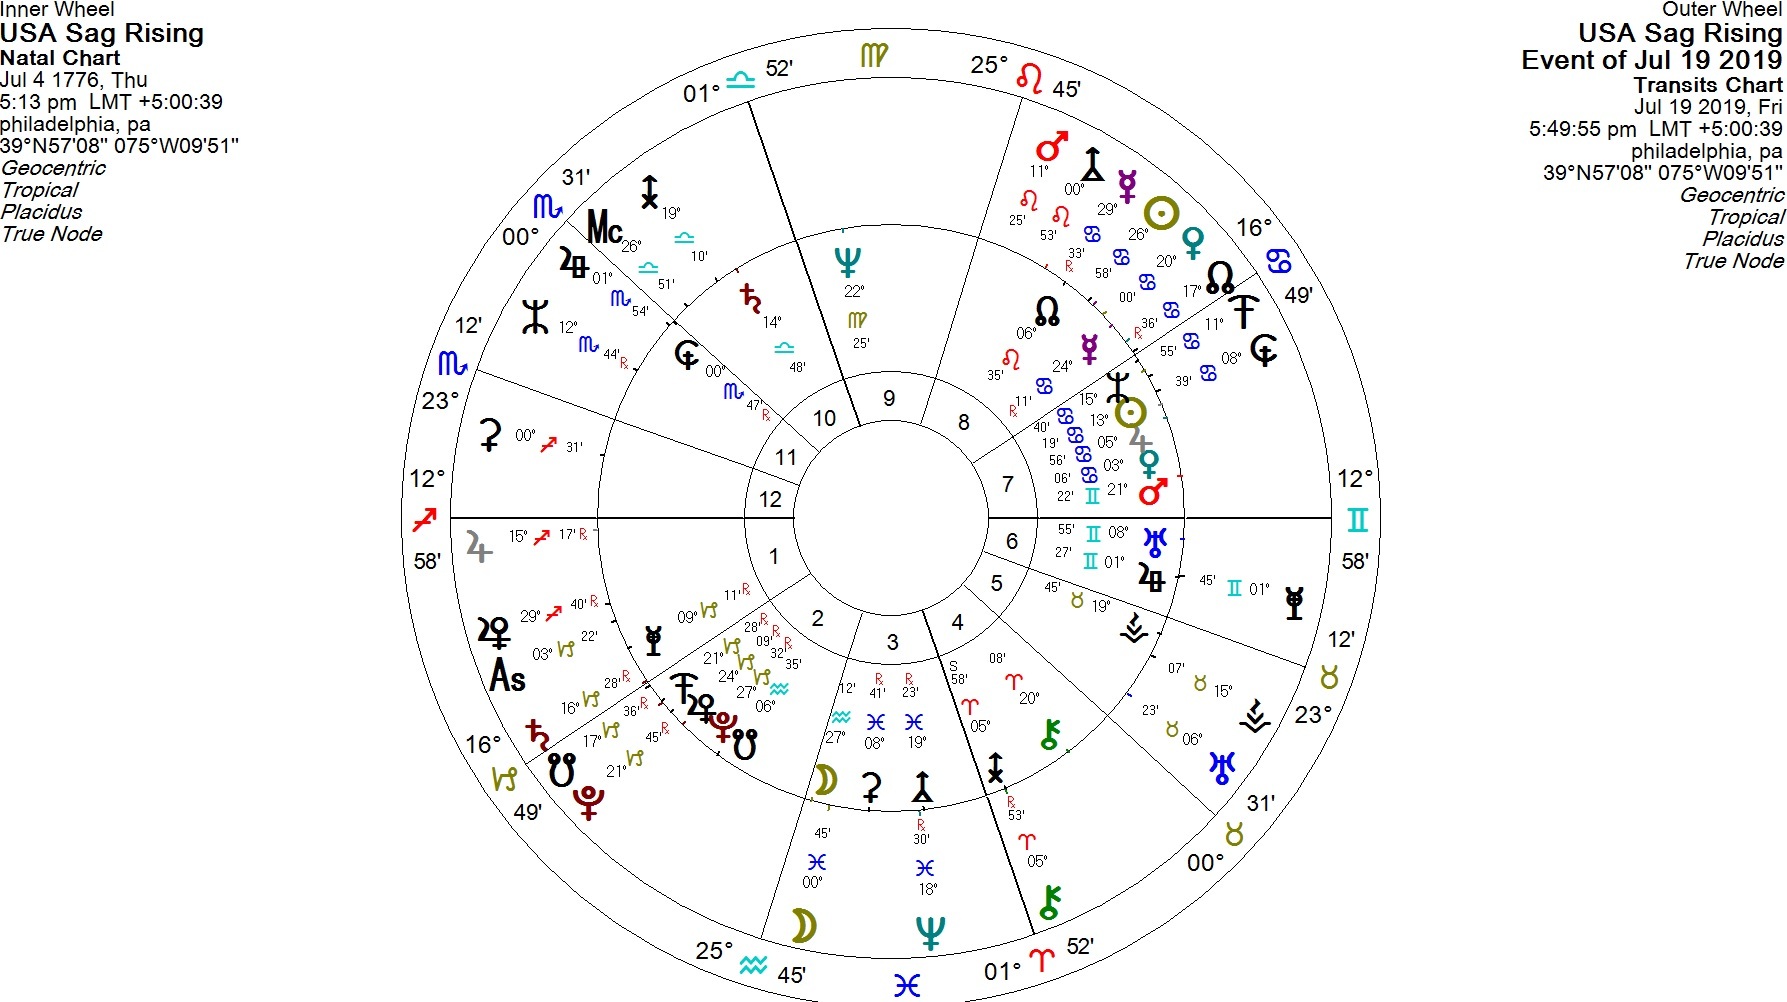
Neptune is about spirituality, weakness, illusion, healing, hospitals and medical care. Legal and illegal drugs, chemicals, poisons, scandal, corruption, fraud and confusion. Film glamour, photography, left-wing politics, socialism, communism, the oceans, oil and gas, and prisons and hidden things.
Vulcanus rules great power and potential. Mars - Vulcanus rules great aggression. In the nineties there was a computer networking boom. With Neptune we may see an increase of war like activity. Vulcanus is a Uranian point.
We may get another war but I'm looking at September 9, 2020 and beyond for a major war effort. That day Mars turns retrograde while squaring the conjunction of Saturn / Pluto.
SP500
We are entering the 7th week of a new Primary cycle which started on June 3, 2019. In the current situation I am looking for a crest of the 6 week cycle and then a move down to the either the 6 week or 9 week cycle trough. It appears the move down to a trough has begun.
If the SP500 has not started down by July 22 I will sit and watch for awhile.
The Sun will change signs into Leo on July 22 which often triggers a change in trend.
Jupiter square Neptune which we have mentioned numerous times may be the real problem as these planets in aspect can be quite inflationary. This may be pointing to serious financial problems late 2019 or early on 2020.
The Jupiter / Neptune square is still in scope and the effects are still being felt. The Saturn / Pluto conjunction is also still in orb. Both will come back to exact conjunction.
Gold
Gold is in the 7th week of the new 18 week Primary cycle. This would be another reason for Gold to go down here and is past due for a 6 week cycle trough. This could go to a 9 week cycle trough (approx., 2 weeks).
The Sun waxing square Uranus can indicate a forming trough often 5 tds after the exact square. This exact square is on July 29, 2019.
Crude's Crude started up on Dec 24, 2018. We are entering the 6th week of the Primary cycle.
We may have had the Primary Cycle trough for crude oil on June 5. This needs more confirmation. Crude may be quite volatile over the summer months and into the late summer (i.e. Sept 21, 2019). Obviously the price of crude will go up if relations with Iran worsen..
SP500
We are currently entering a new Primary cycle starting on June 3, 2019. We are 6 weeks along.
I’m looking at this as a Primary cycle trough and going up in a new Primary. The new Primary started on June 3 and we are 7 weeks along. Remember the Jupiter square Neptune where lies are covered up and general untruths are spoken. It is still in orb.
The Primary cycle is approx.18 weeks and is typically composed of 3- 6 week sub-cycles or 2-9 week sub-cycles or a combo of both.
The 15 day sma is red, the 45 day sma is blue and the light blue is the 200 day sma. Note; the normal Fibonacci retracement levels are 23.6%, 38.2%, 50.0 %, and 61.8%.
One can also use extended retracements which typically use the square roots of one of the above. So, I also use SqrRoot(61.8) = 78.6 and SqrRoot(78.6) = 88.6.
The green vertical lines are a 27 CD (calendar day) cycle next due Aug 7, 2019.
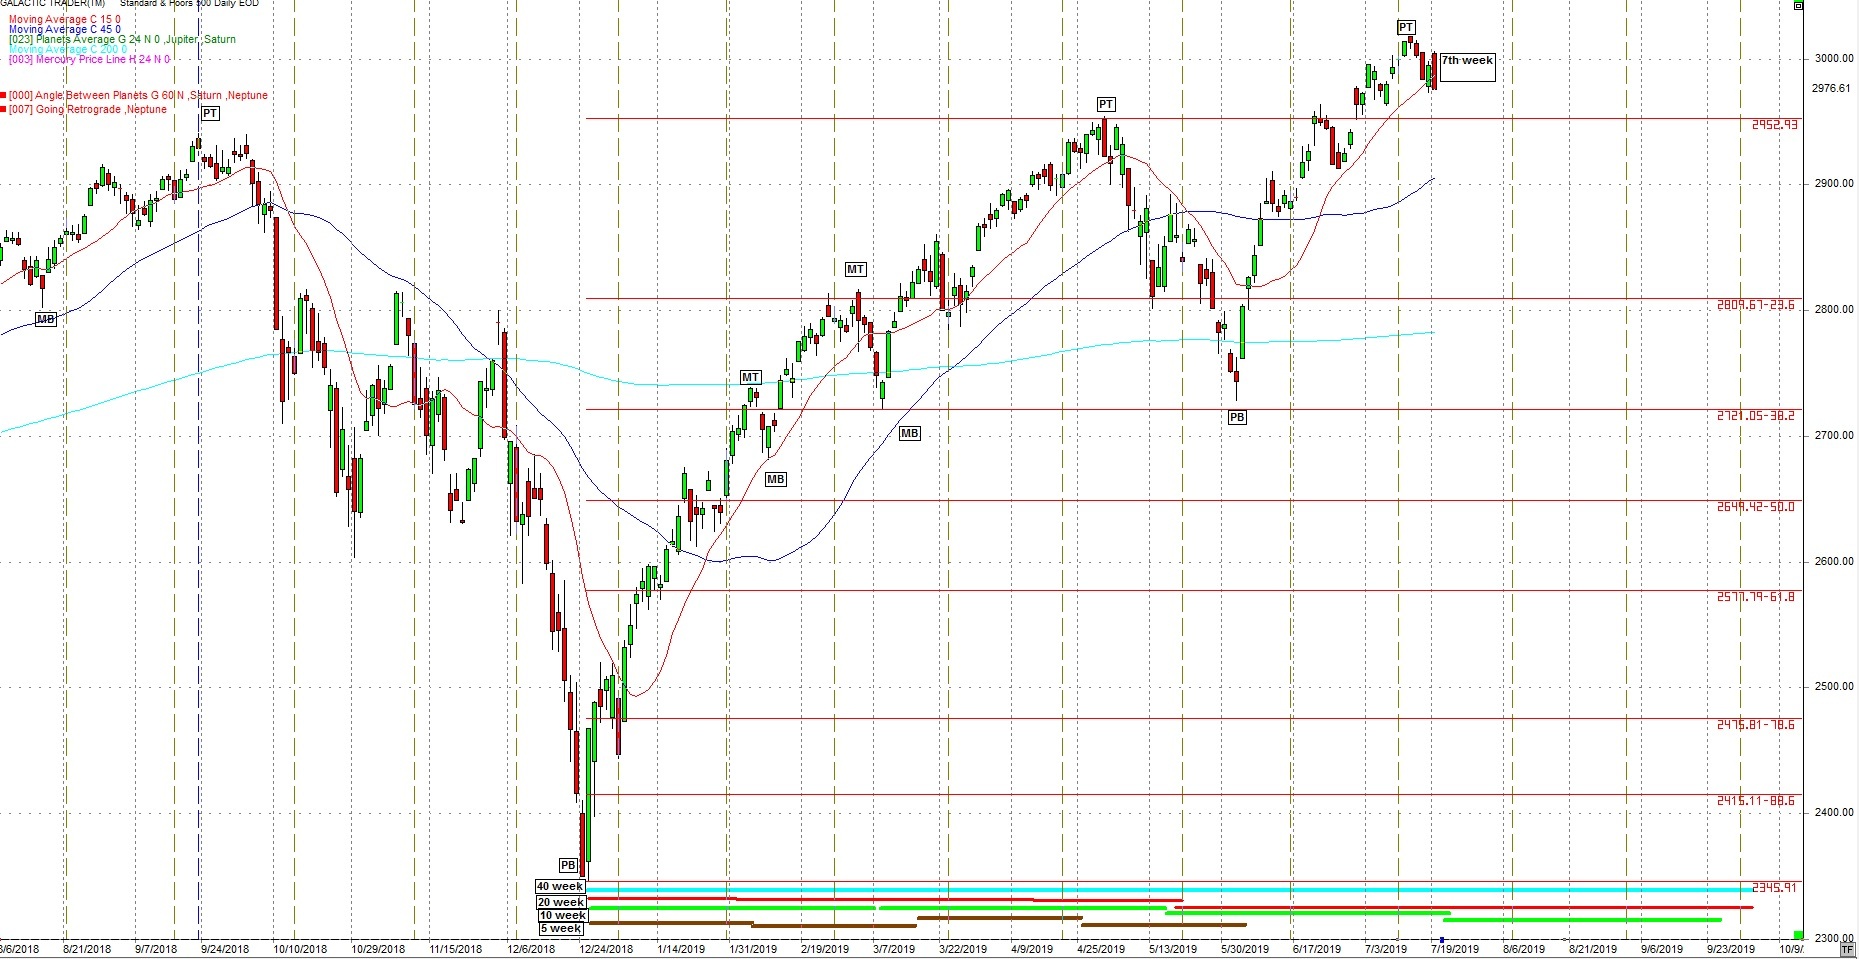
The above daily chart shows upcoming medium term cycles at the bottom of the chart.
Light blue is the 40-week
Red is the 20-week
Light green 10-week
Brown is the 5 week
The coming week may be very volatile.
Whenever we get longer term aspects we should look at other planets in transit that may hit the longer term aspect.
When looking at any Astro analysis for 2019 we should remember the effect of Jupiter square Neptune and Saturn conjunct Pluto. These aspects will be with us all year and beyond.
All dates +- 3 td’s (trading days) at a minimum.
From the last few posts:
“This coming year could see an increase in geophysical activity, both earthquakes and volcanos.” “Late June through early July may see more geophysical activity.”
See the link under “Earthquakes”. This is an application from the USGS. Geophysical activity has been picking up.
We may be seeing a war develop but if so, I would expect war like activity in the fall.
Although we do not have enough data the 45 year cycle is pointing to Sept 2022 this could also be the 90 year cycle. We do not have enough data to make the 90 year call. For a 90 year cycle I’m looking at the years 1842 – 1932 and then 2022.
The following daily chart of the SP500 shows 2 Envelope channels. Red is the centered
20 week envelope channel. Blue is the centered 40 week envelope channel.
The blue squares are the dates of the Mars square Uranus transit. Next up July 11, 2019.
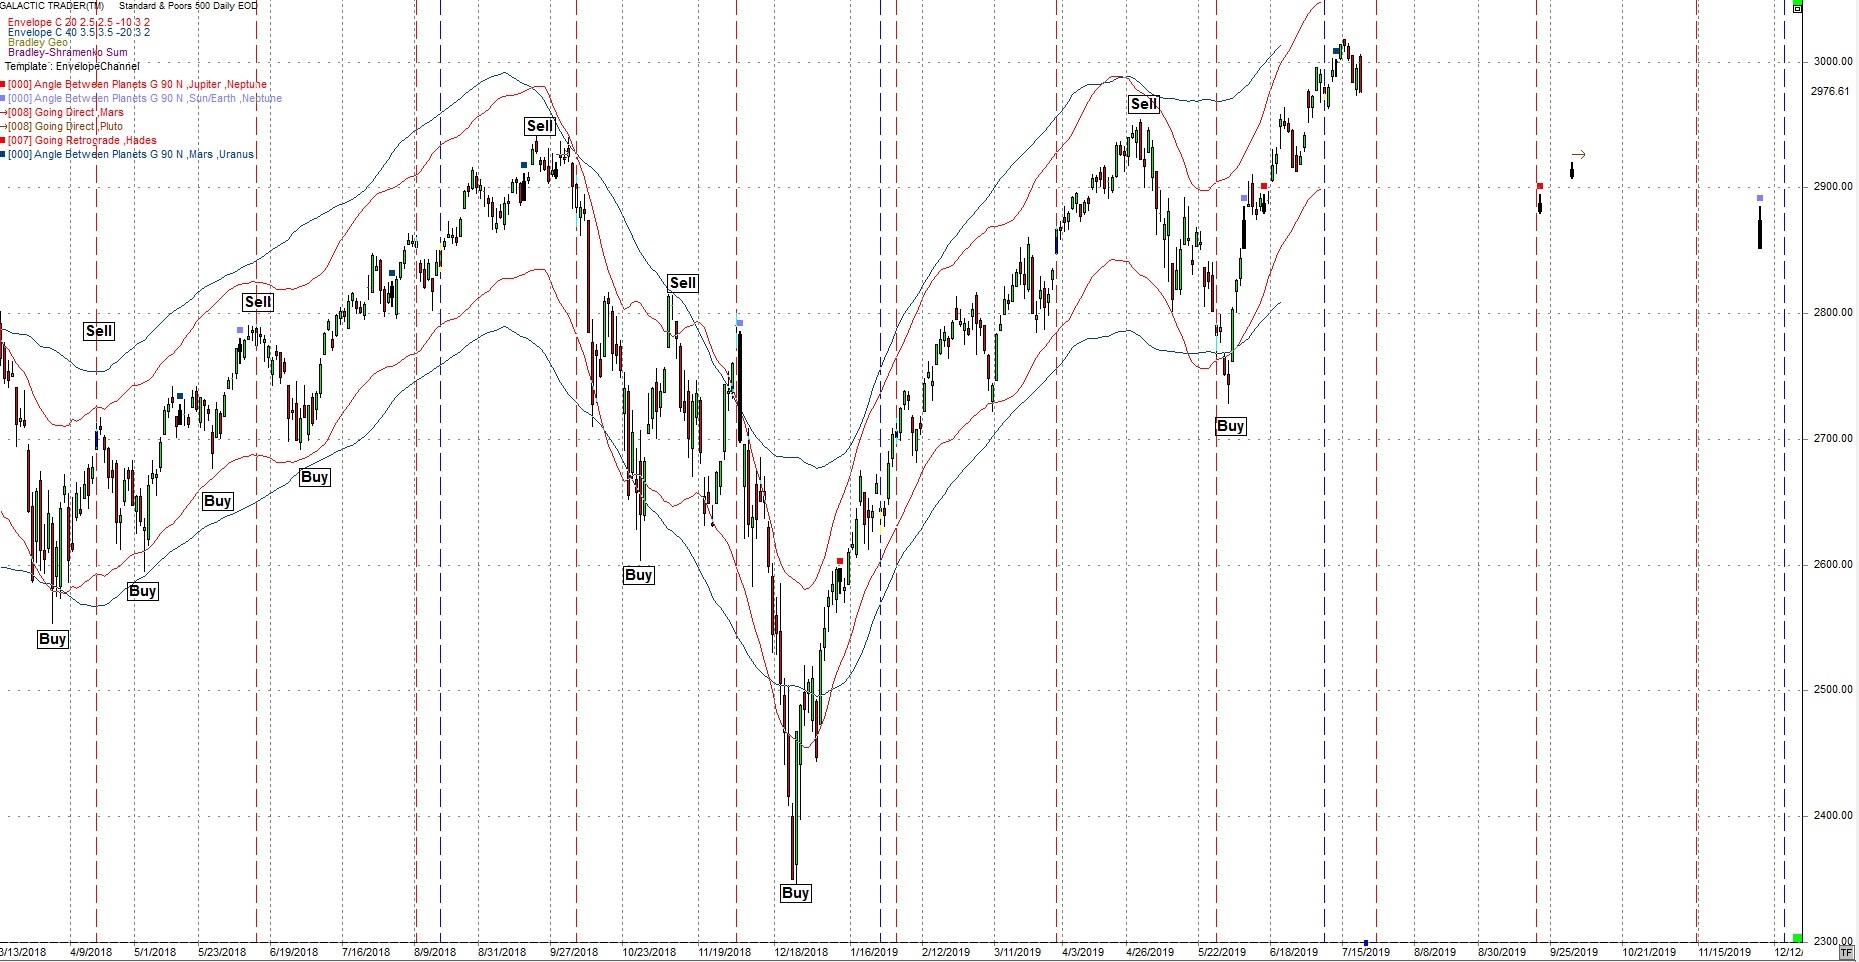
The red averages are based on the 20 week so they are shifted 10 weeks or a ½ cycle. This is known as a centered moving average.
I brought up Iran on the last couple of posts. Iran may be active. Watch the period around July 13, 2019 and forward for problems with Iran. July 13 has transiting Hades conjunct natal Vulcanus in Iran;s chart. If there is going to be a war I would look to the fall of 2019 or early 2020.
Watch for news from India and Pakistan as well.
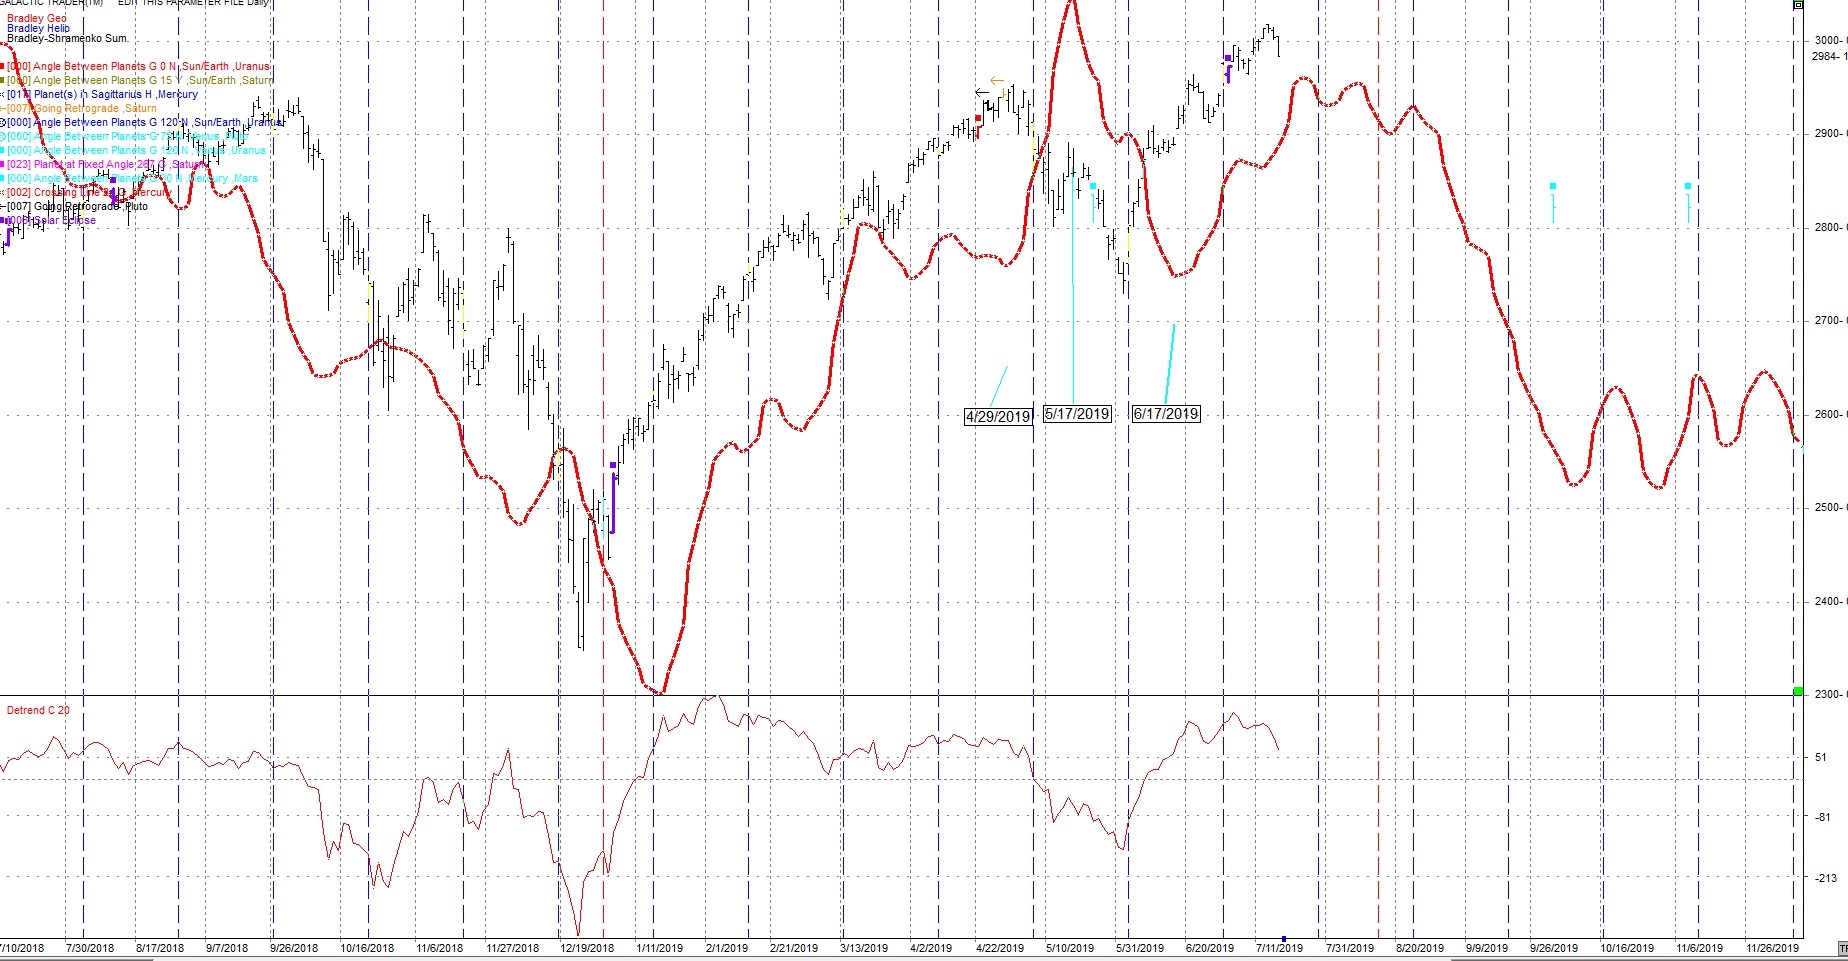
The Bradley Indicator
This stock index forecasting tool was designed by astrologer Donald Bradley and published in 1947 in a booklet titled "Stock Market Prediction".
On the cover this tool is called the Planetary Barometer and inside the booklet it is called a Siderograph. Now it is simply called "the Bradley". The
Bradley is meant to forecast major and minor turning-points (where a trend will reverse) in either the Dow Jones Industrial Average or SP500 indexes. Bradley's work was obviously on the DJIA.
It does not forecast or anticipate whether that turning-point will be a high or a low. It has no polarity. The Bradley may turn up while the DJIA turns down. The amplitude of the Bradley swing is also not important. It only finds periods where trend changes occur.
It should be understood Astrologers in decades gone by who had no computers, spreadsheets, or databases to analyze data typically worked with much smaller data sets than we do today. This maybe why the Bradley worked so well when it first came out in 1947 but now is somewhat unreliable. Now, it goes through periods where it works fairly well but then can stop operating for months at a time. Originally it was for geocentric astrology (Earth centered) but there are now heliocentric models (Sun centered) and others.
In Bradley's own words:
"At no time must the reader gain the impression that a siderograph, as such, is a prediction of what the stock market will actually do. Nevertheless, observation proves that basic reversals in collective attitudes, clearly predicted by the line, are inevitably mirrored in stock averages"
So if the Bradley only identifies trend changes, what are trend changes?
- a rising market changes to a falling market
- a rising market changes to sideways
- a sideways market starts going up
- a sideways market starts going down
- a market going down changes to a rising market
- a falling market starts going sideways
The indicator is pointing to a change in trend for the SP500.
Author

TradingDaze
Aisys Technologies Inc.
Gordon Lawson, aka TradingDaze, is a Canadian CPA, certified computer programmer and Astrologer. My traditional career spanned 25 years as a Financial Analyst at Suncor and Manager of Information Systems at BP Resources Canada. After this time Mr.


