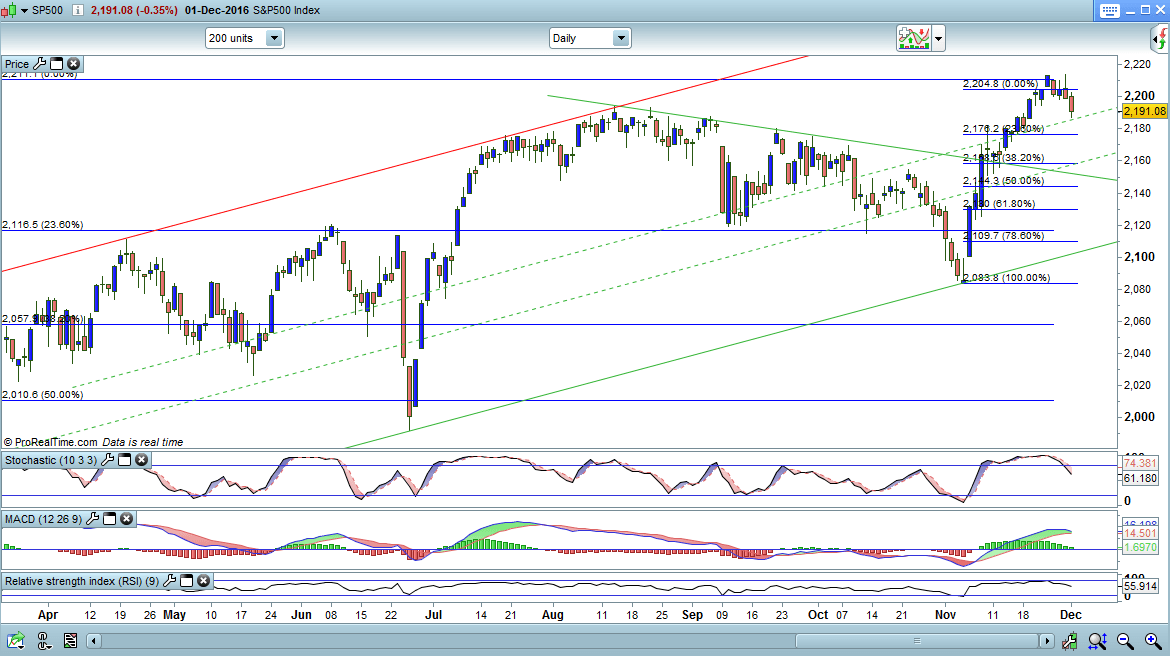
SUPPORT: 2187 1277/75 2172 2162 2158/56 2152 2147/46 2134
RESISTANCE: 2193 2196/97 2204/05 2210 2214* 2220 2225 2243 2268 2289 2309 2335
Good short term support coming in @ 2187...Market slightly oversold short term...but this is to be expected after the fall from 2214...However...med term charts remain looking weak...2183 is your next big level really...If we break below here 2175 would be the targeted area....Any longs currently are to be used short term only and we would like any correction now to hold below the 2204 area....Weekly and monthly charts remain looking quite negative...so this would help the market sell off if we could correct some of the recent decline...Overall markets look awful...and the Nas has shown the way...This never got near ALT and reversed..Please keep looking at this market if trading S&P ...it will help with direction...DJI also posted reversal days...Now all we need is a reversal week in the S&P and we will look in an even worse state that we do now....As Iv said...there is nothing technically that I can see that would provoke a sharp move higher at this point...Reversal Thursday kicked in...but as always we await NFP and get the blips and headless chicken brigade out of the way in the first hr...and then await Wall St as these are the guys that will determine where we go for the next few weeks.....2204 breaks there is scope for 2210/13 again...but sellers will be here to keep the market under threat...especially if the Nas does not make a break topside....
The research provided by Charmer Charts is provided solely to enable clients to make their own investment decisions and does not constitute personal investment recommendations. No recommendations are made directly or indirectly by Technicalanalysisreports.com or Charmer Charts as to the merits or suitability of any investment decision or transaction that may result directly or indirectly from having viewed the technical analysis investment research. Customers are therefore urged to seek independent financial advice if they are in any doubt. The value of investments and the income derived from them can go down as well as up, and you may not get back the full amount you originally invested. Derivatives and foreign exchange trading are particularly high-risk, high-reward investment instruments and an investor may lose some or all of his or her original investment. Also, if you decide to acquire any investment denominated in a different currency you should note that changes in foreign exchange rates may have an adverse effect on the value, price and income of the investment in your own currency. Technicalanalysisreports.com or Charmer Charts shall not be liable for any direct or indirect, incidental or consequential loss or damage (including loss of profits, revenue or goodwill) arising from the use, inability to use, interruption or non-availability of the technical analysis investment research or any part of the research materials published or otherwise any loss of data on transmission, howsoever caused. Whilst the research material published is believed to be reliable and accurate, it is not independently verified. Accordingly, no representation or warranty is made or given by Technicalanalysisreports.com or Charmer Charts, its officers, agents or employees as to the accuracy or completeness of the same and no such person shall have liability for any inaccuracy in, or omission from, such materials.
Recommended Content
Editors’ Picks
EUR/USD trades weak below 1.0800 amid Good Friday lull, ahead of US PCE
EUR/USD remains depressed below 1.0800 after soft French inflation data, amid minimal volatility and thin liquidity on Good Friday. The pair keenly awaits the US PCE inflation data and Fed Chair Powell's speech for fresh hints on next week's price action.
GBP/USD holds steady above 1.2600 as markets stay calm on Good Friday
GBP/USD trades sideways above 1.2600 amid a typical Good Friday trading lull. A broadly firmer US Dollar could keep any upside attempts limited in the pair ahead of the US PCE inflation data and Fed Chair Powell's appearance.
Gold reaches to all-time highs near $2,230, US PCE eyed
Gold price appreciates to all-time highs near $2,230 per troy ounce, attempting to continue its winning streak for the fifth successive session on Friday. However, trading volumes are light as market participants are likely observing Good Friday.
Jito price could hit $6 as JTO coils up inside this bullish pattern
Jito (JTO) price has been on an uptrend since forming a local bottom in early January. Since then, JTO has revisited the key swing point formed in early December, suggesting the bulls’ intention to move higher.
Key events in developed markets next week
Next week, the main focus will be inflation and the labour market in the Eurozone. We expect services inflation to be impacted by the easter effect, while the unemployment rate to be unchanged.