S&P 500 Reversed Higher, No Fear Again
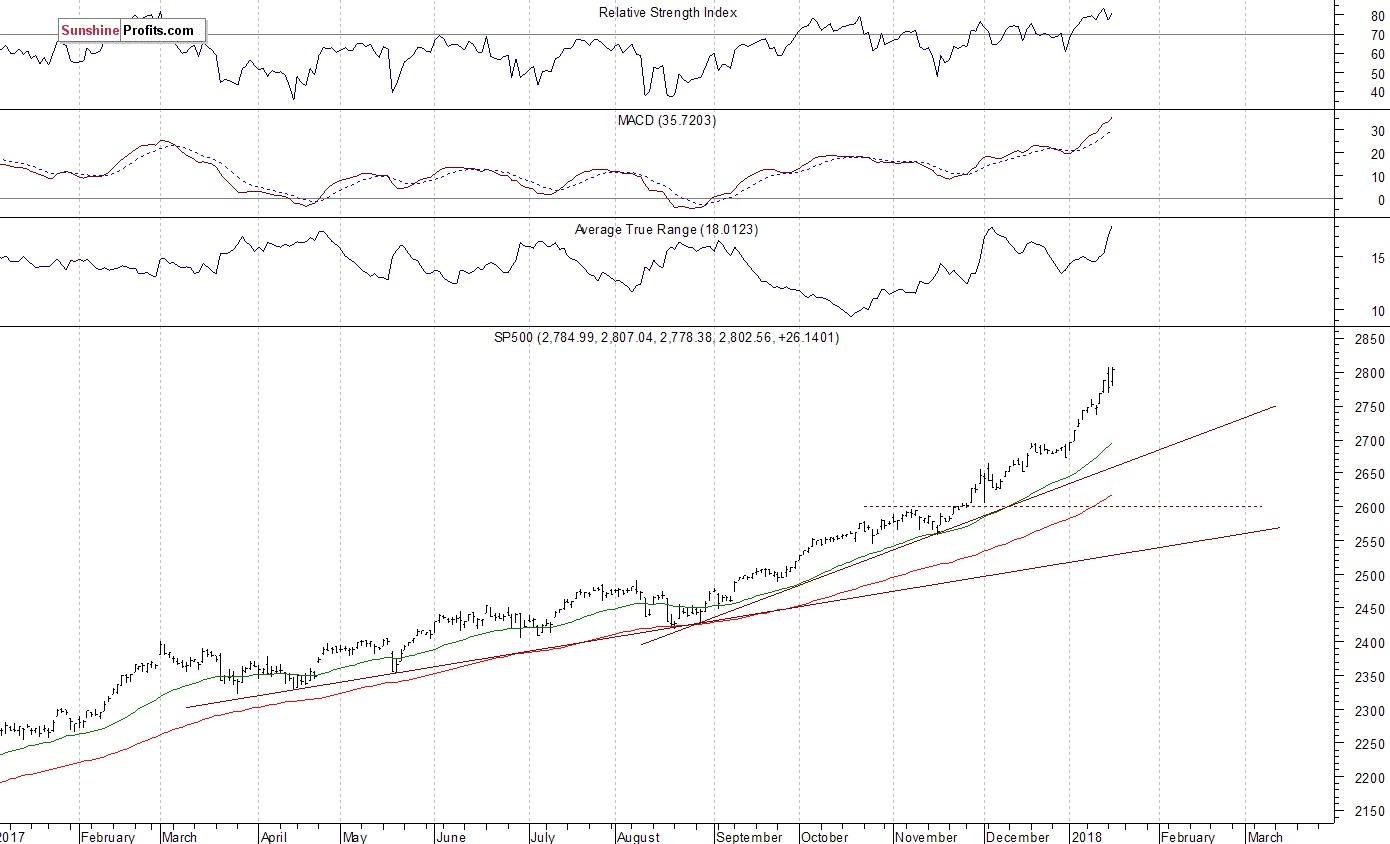
The main U.S. stock market indexes gained between 0.9% and 1.3% on Wednesday, retracing their Tuesday's move down, as investors' sentiment improved following better-than-expected Industrial Production data release, among others. The S&P 500 index trades just 0.2% below its Tuesday's record high of 2,807.54. The Dow Jones Industrial Average reached new record high of 26,130.45 yesterday, and the technology Nasdaq Composite remained below Tuesday's new all-time high. The nearest important level of support of the S&P 500 index is at around 2,800. The next support level is at 2,765-2,770, marked by Friday's daily gap up of 2,767.56-2,769.64. The support level is also at around 2,760, marked by last Tuesday's local high. On the other hand, resistance level is now at 2,805-2,810, marked by new all-time high. We still can see medium-term technical overbought conditions along with negative technical divergences. Was Tuesday's trading session some major downward reversal day? Downward reversal day is a day in which the price reaches new high followed by a lower close. For now, it looks like a short-term consolidation following recent rally:
Flat Expectations
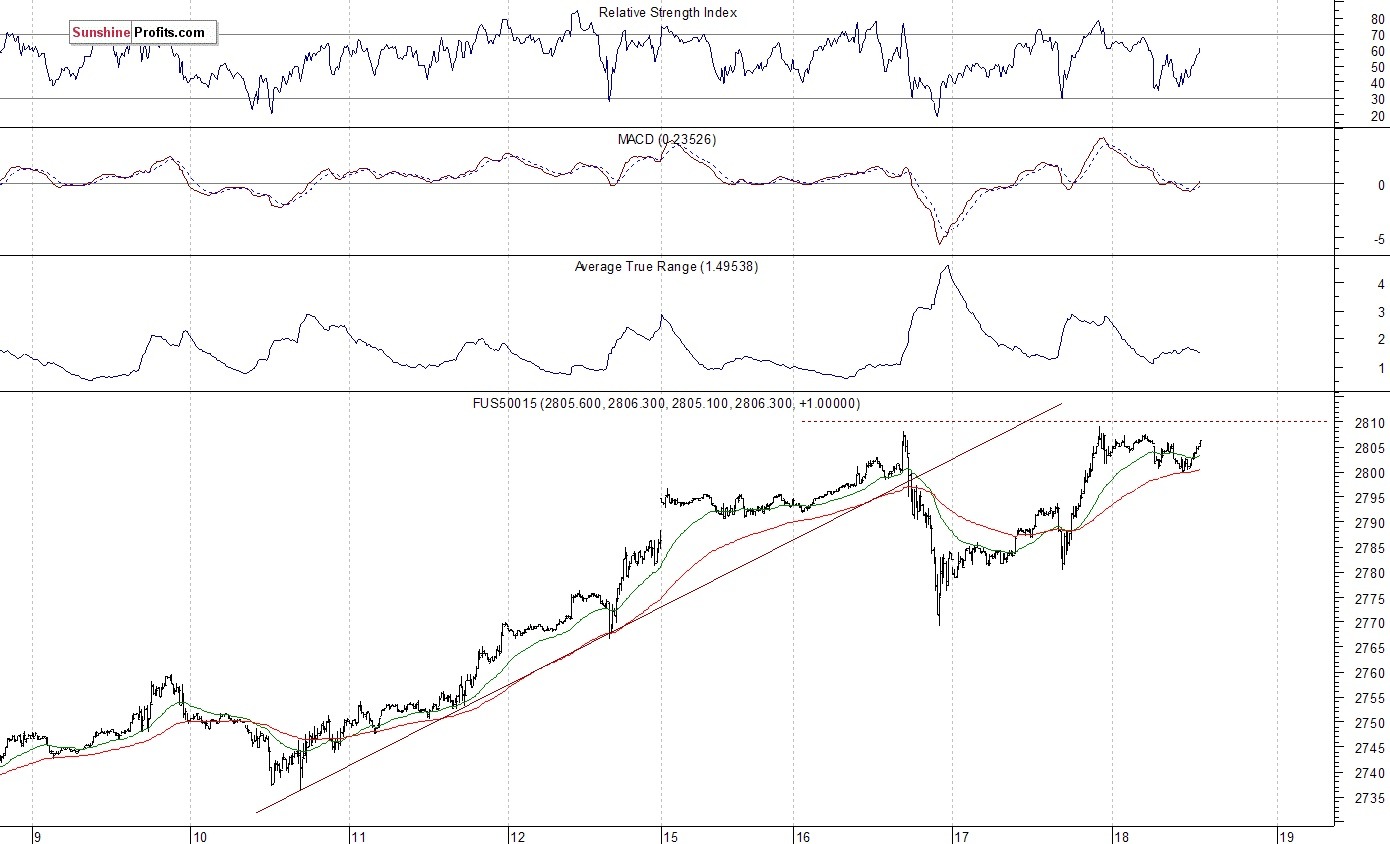
Expectations before the opening of today's trading session are virtually flat, with index futures currently between 0.0% and +0.1% vs. their Wednesday's closing prices. The European stock market indexes have been mixed so far. Investors will wait for some economic data announcements: Housing Starts, Building Permits, Philadelphia Fed Manufacturing Index, Initial Claims at 8:30 a.m., Crude Oil Inventories at 10:30 a.m. The market expects that Housing Starts were at 1.28M, and Building Permits were at 1.29M in December. The S&P 500 futures contract trades within an intraday consolidation following yesterday's move up. The nearest important level of resistance is at around 2,810, marked by record high. On the other hand, support level is now at 2,800. The next level of support is at 2,780, marked by yesterday's intraday local low. The futures contract is back at its record high this morning, as the 15-minute chart shows:
Nasdaq 100 Above 6,800 Again
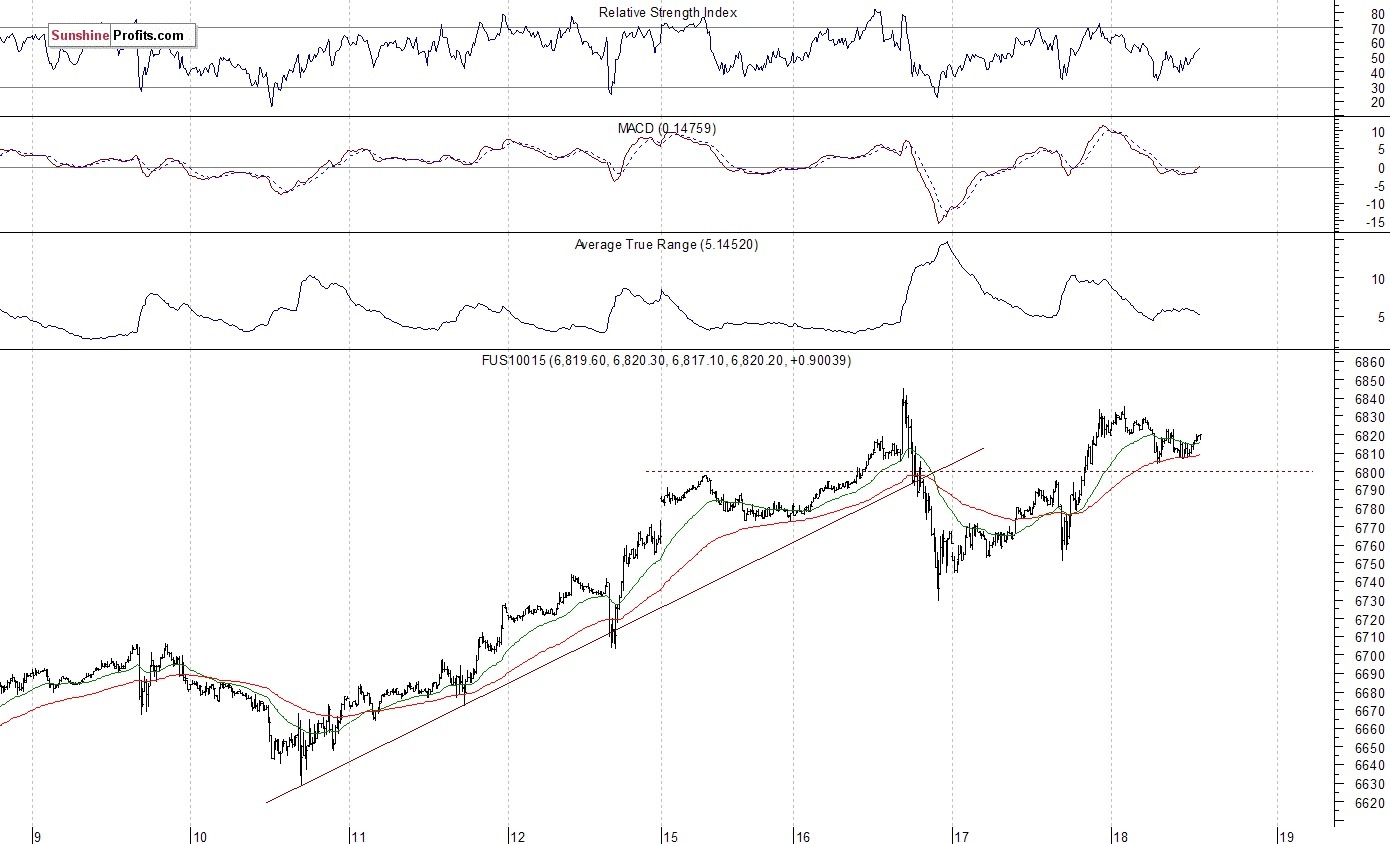
The technology Nasdaq 100 futures contract follows a similar path, as it fluctuates after its yesterday's rebound off support level at around 6,750. The market is close to its record high again. The nearest important resistance level is at 6,830-6,850. On the other hand, level of support is at 6,800, among others. The Nasdaq 100 futures contract trades within a short-term consolidation along the level of 6,800, as we can see on the 15-minute chart:
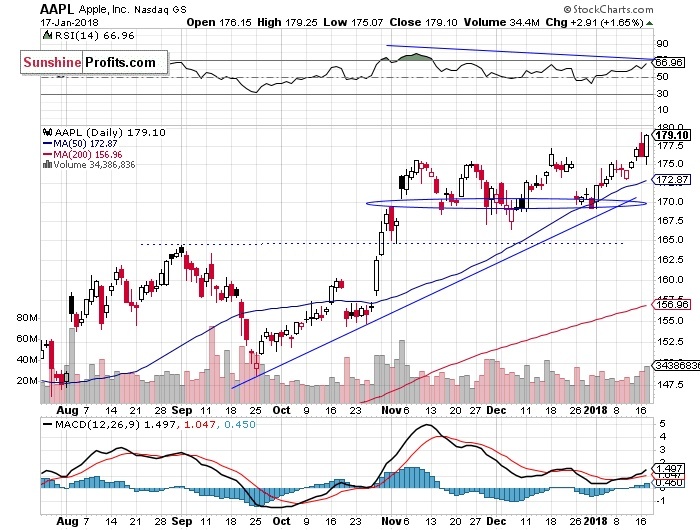
Let's take a look at Apple, Inc. stock (AAPL) daily chart (chart courtesy of http://stockcharts.com). The stock reached new record high on Tuesday, before closing below its Friday's closing price. However, it retraced its Tuesday's sell-off yesterday and got closer to record high again. The nearest important support level remains at around $175, marked by previous resistance level:
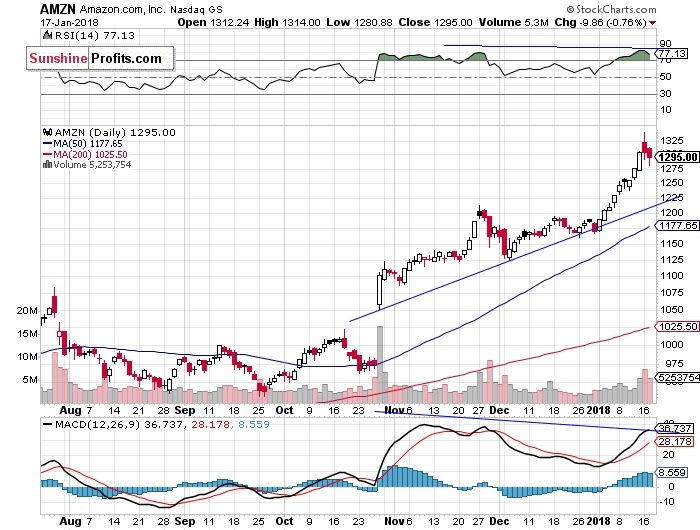
Amazon.com, Inc. stock (AMZN) was relatively stronger than the broad stock market recently. It accelerated its medium-term uptrend and broke above $1,300 mark. We can see some relative weakness since Tuesday, as the price retraces some of its advance. Is this an uptrend reversal or just quick correction before another leg up?
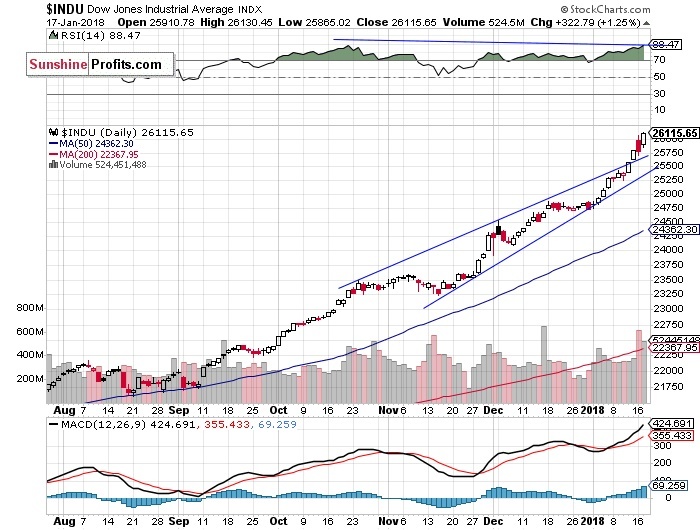
The Dow Jones Industrial Average daily chart shows that blue-chip index reached new record high, as it retraced its Tuesday's decline. We still can see negative technical divergences. The most common divergences are between asset’s price and some indicator based on it (for instance the index and RSI based on the index). In this case, the divergence occurs when price forms a higher high and the indicator forms a lower high. It shows us that even though price reaches new highs, the fuel for the uptrend starts running low. The index broke above its two-month-long rising wedge pattern on Friday:
Concluding, the S&P 500 index reached new record high on Tuesday, before reversing and closing lower. It seemed like some major downward reversal day, but the market retraced this whole move down yesterday. Will uptrend continue? Probably not. We may see some short-term fluctuations along new record highs. For now, it looks like a consolidation within an uptrend. There have been no confirmed negative signals so far.
Want free follow-ups to the above article and details not available to 99%+ investors? Sign up to our free newsletter today!
Author

Paul Rejczak
Sunshine Profits
Paul Rejczak is a stock market strategist who has been known for the quality of his technical and fundamental analysis since the late nineties.


