S&P 500 correction looming just as in Gold – or not?

Stocks are clinging to the 3,900 level, and the bulls aren‘t yielding. Without much fanfare, both the sentiment readings and put/call ratio are at the greed and compacent end of the spectrum again. How long can it last, and what shape the upcoming correction would have? Right now, the warning signs are mounting, yet the bears shouldn‘t put all their eggs into the correction basket really, for it shapes to be a shallow one – one in time, rather than in price.
Gold‘s hardship is another cup of tea, standing in stark comparison to how well silver and platinum are doing. At the same time, the dollar hasn‘t really moved to the upside – there is no dollar breakout. If the greenback were to break to the upside, that would mean a dollar bull market, which I don't view as a proposition fittingly describing the reality – I calledthe topping dollar earlier this week. The world reserve currency will remain on the defensive this year, and we saw not a retest, but a local top.
This has powerful implications for the precious metals, where the only question is whether we get a weak corrective move to the downside still, or whether we can base in a narrow range, followed by another upleg (think spring). February isn't the strongest month for precious metals seasonally, true, but it isn't a disaster either. As has been the case throughout the week, I‘ll update and present the evidence of internal sectoral strength also today.
One more note concerning the markets – in our print-and-spend-happy world, where the give or take $1.9T stimulus will sooner or later come in one way or another, we better prepare on repricing downside risk in the precious metals, and also better not to fixate on the premature bubble pop talk too closely. I have been stating repeatedly that things have to get really ridiculous first, and this just doesn‘t qualify yet in my view. All those serious correction calls have to wait – in tech and elsewhere, for we‘re going higher overall – like it or not.
Let‘s get right into the charts (all courtesy of www.stockcharts.com).
S&P 500 Outlook and Its Internals
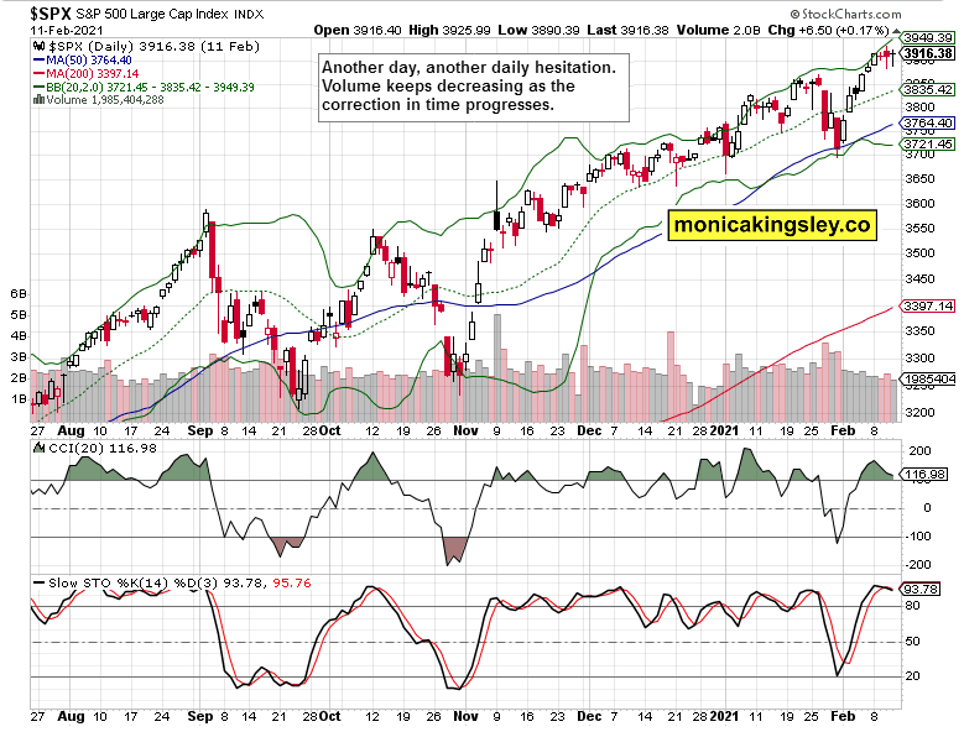
Third day of hesitation, this time again with a thrust to the downside. Marginally increasing volume, which speaks of not too much conviction by either side yet. As the very short-term situation remains tense, my yesterday‘s words still apply today:
(…) I think this corrective span has a bit further to run in time really. (…) the bears are just rocking the boat, that‘s all.
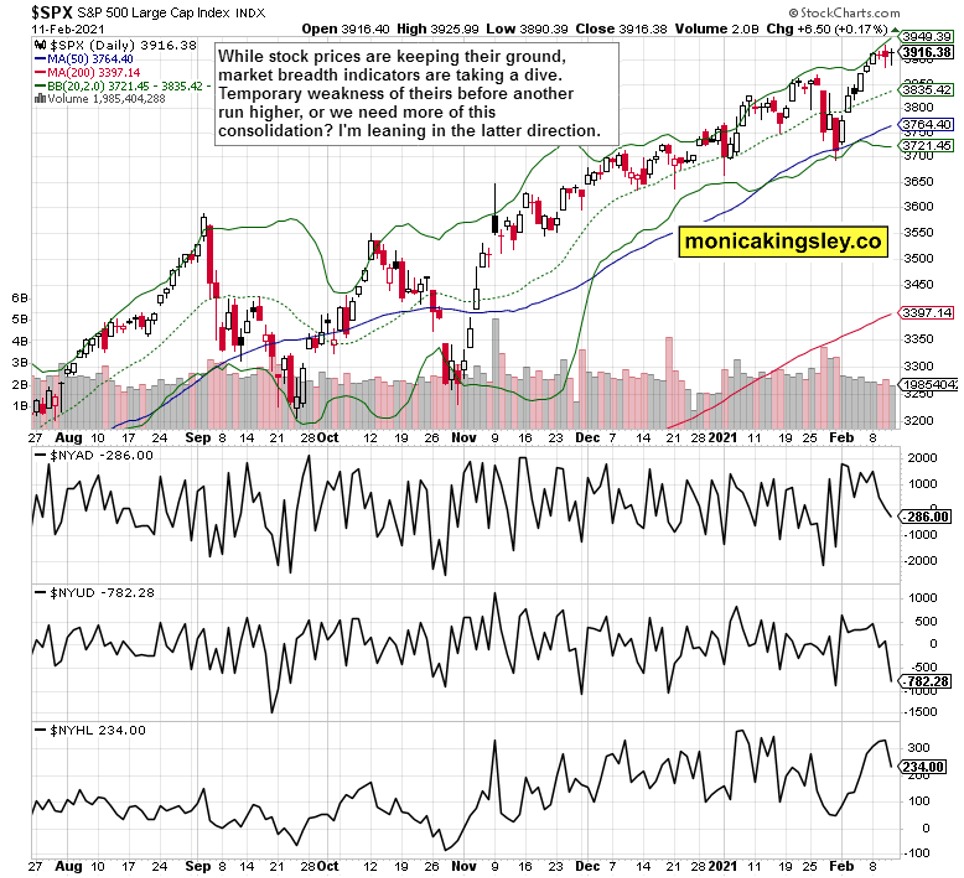
The market breadth indicators are deteriorating, without stock prices actually following them down. Thus far, the correction is indeed shaping to be one in time and characterized by mostly sideways trading. Unless you look at the following chart.
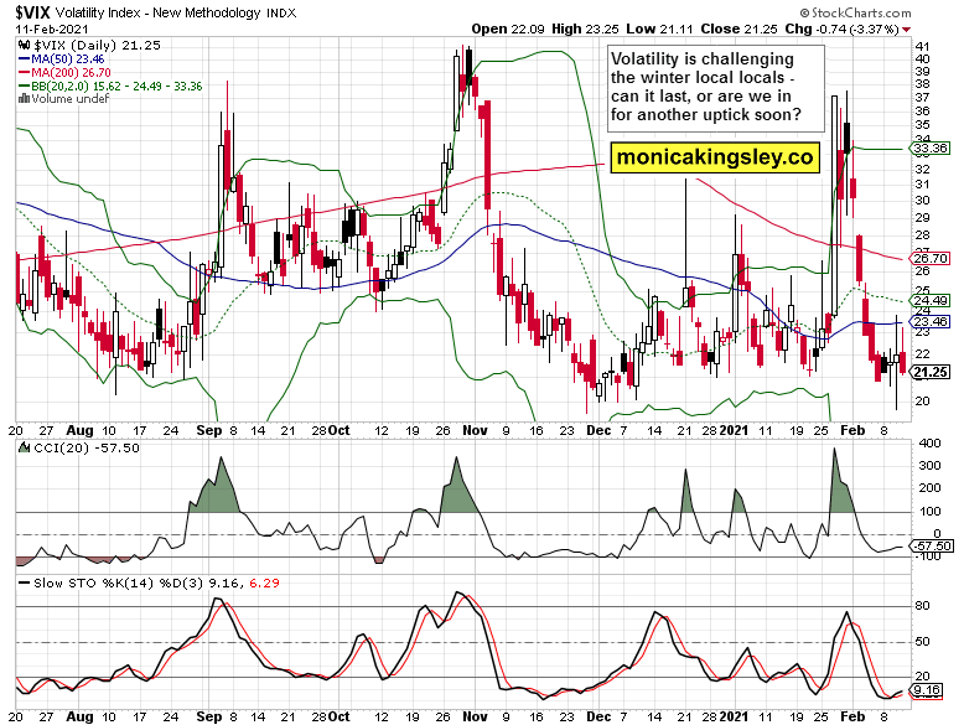
Volatility has died down recently, yet a brief spike (not reaching anywhere high, just beating the 24 level) wouldn‘t be unimaginable to visit us by the nearest Wednesday. In all likelihood, it would be accompanied by lower stock prices. Well worth watching.
Credit Markets and Tech
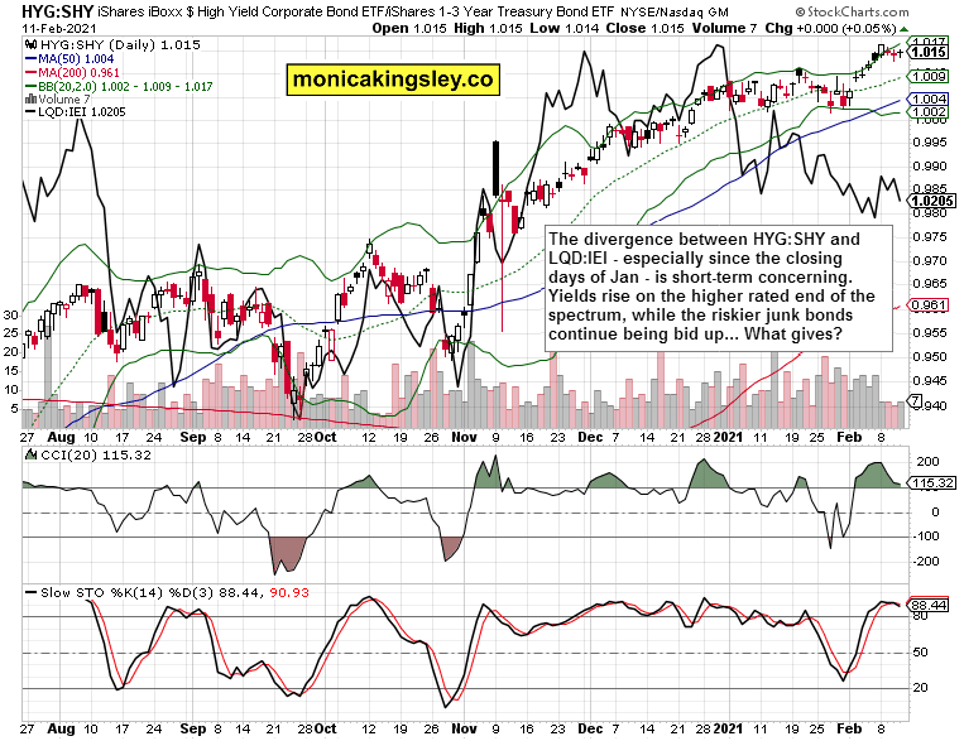
There is a growing discrepancy between high yield corporate bonds (HYG ETF) and its investment grade counterpart (LQD ETF). Both leading credit market ratios have been diverging not only since the end of Jan, but practically throughout 2021. The theme of rising yields is exerting pressure on the higher end of the debt market as the stock investment fever goes on – that‘s my take.
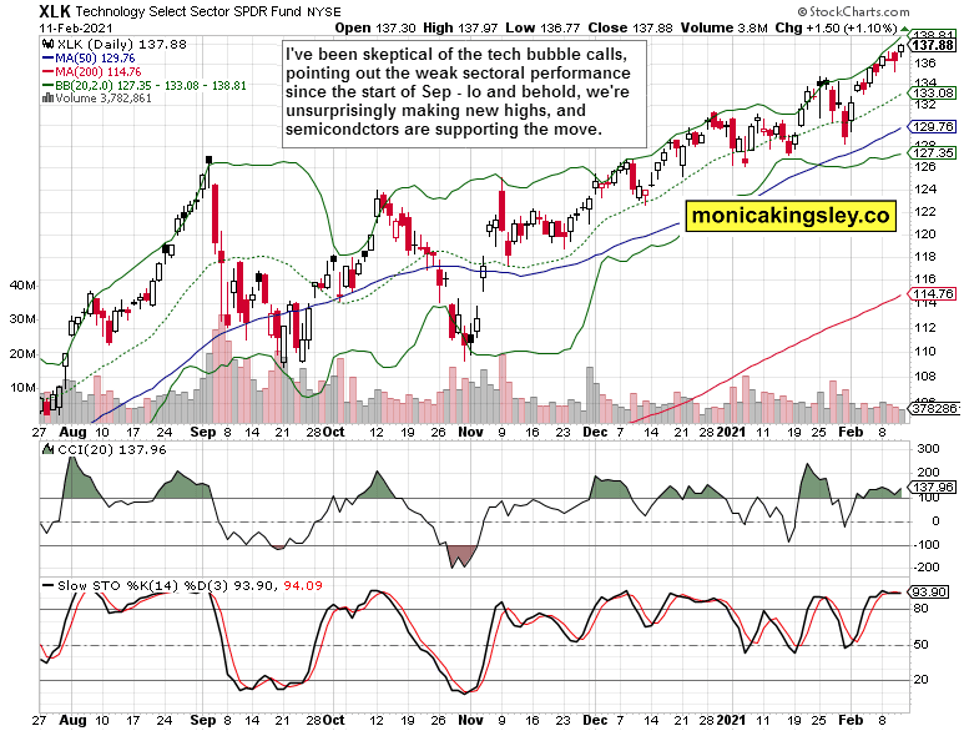
No, this is not a bubble – not a parabolic one. The tech sector is gradually assuming leadership in the S&P 500 advance, accompanied by microrotations as value goes into favor and falls out of it, relatively speaking. Higher highs are coming, earnings are doing great, and valuations aren‘t an issue still.
Gold, Silver and Ratios
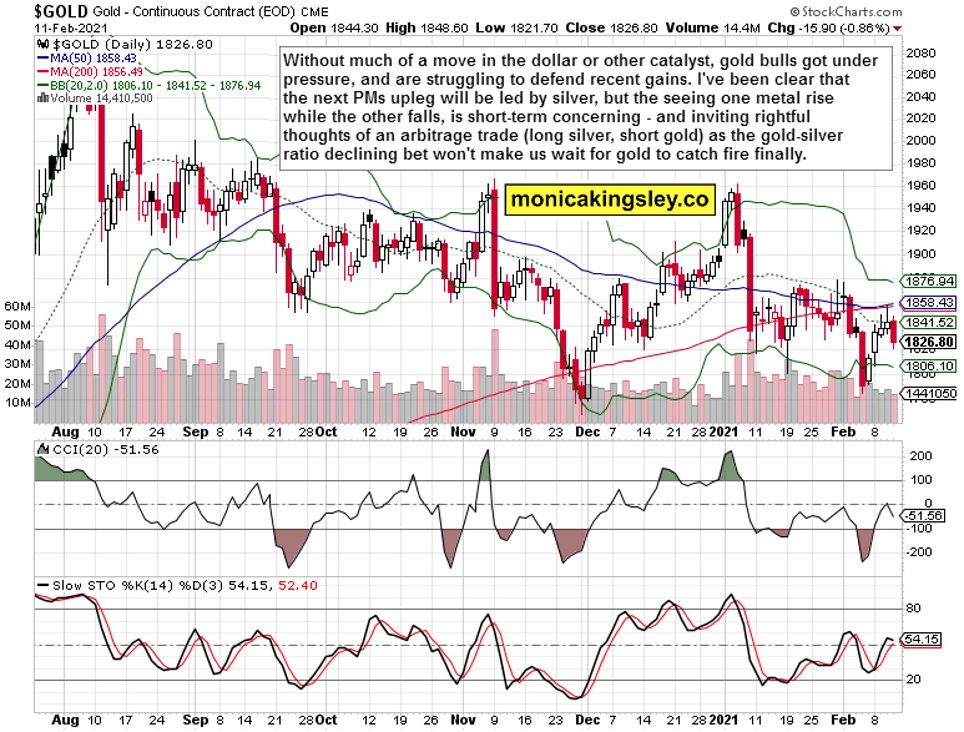
Under pressure right as we speak ($1,815), the yellow metal‘s technical outlook hasn‘t flipped bearish. Should we get to last Thursday‘s lows, it would happen on daily indicators ready to flash a bullish divergence once prices stabilize. But for all the intense bearish talk, we haven‘t broken below the late Nov lows.
For those inclined so, I am raising the arbitrage trade possibility. Long silver, short gold would be consistent with my prior assessment of the gold-silver ratio going down. Similarly to bullish gold bets, that‘s a longer-term trade, which however wouldn‘t likely take much patience to unfold and stick.
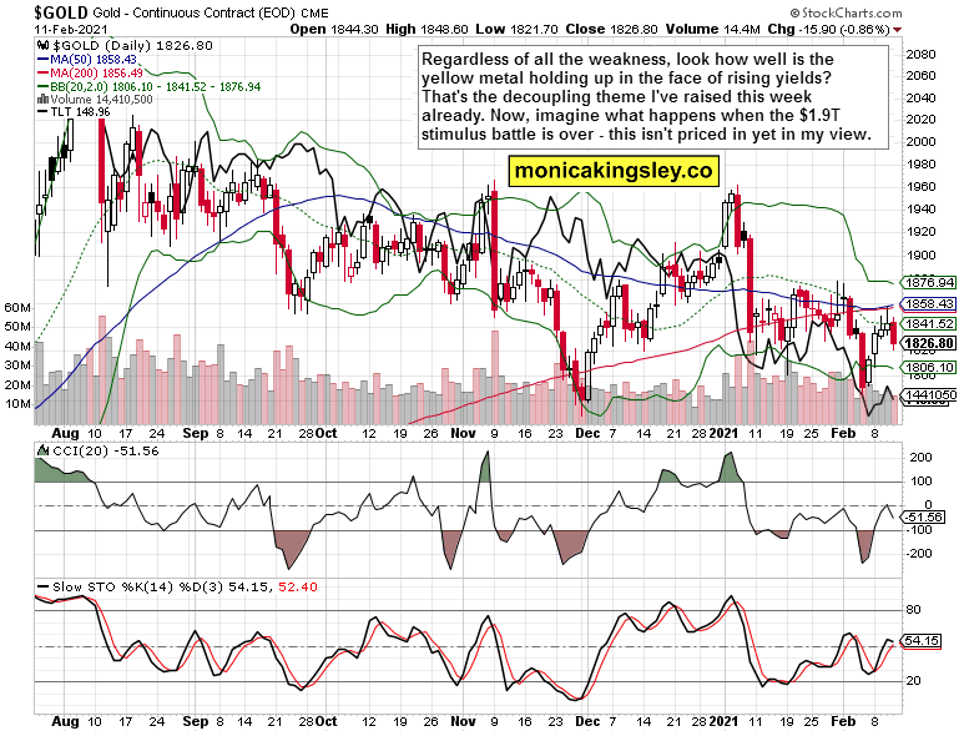
A bullish chart showing that gold isn‘t following the rising yields all that closely these days. Decoupling from the Treasury yields is a positive sign for the sector, and exactly what you would expect given the (commodity) inflation and twin deficits biting.
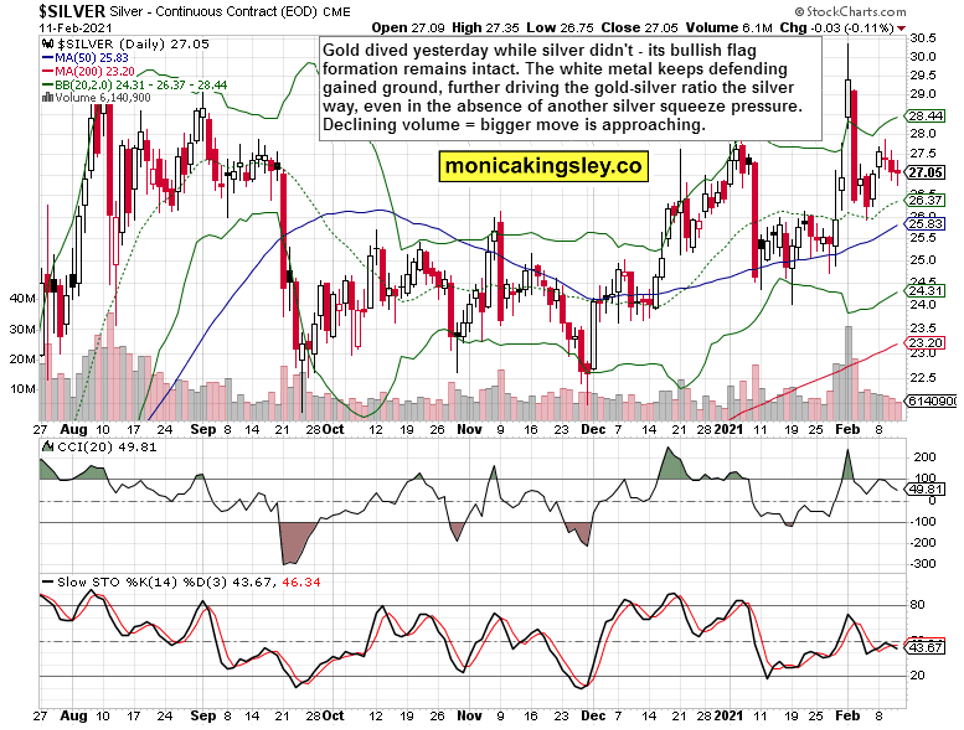
Silver continues to trade in its bullish consolidation, and unlike in gold, its short-term bullish flag formation remains intact. The path of least resistance for the white metal remains higher.
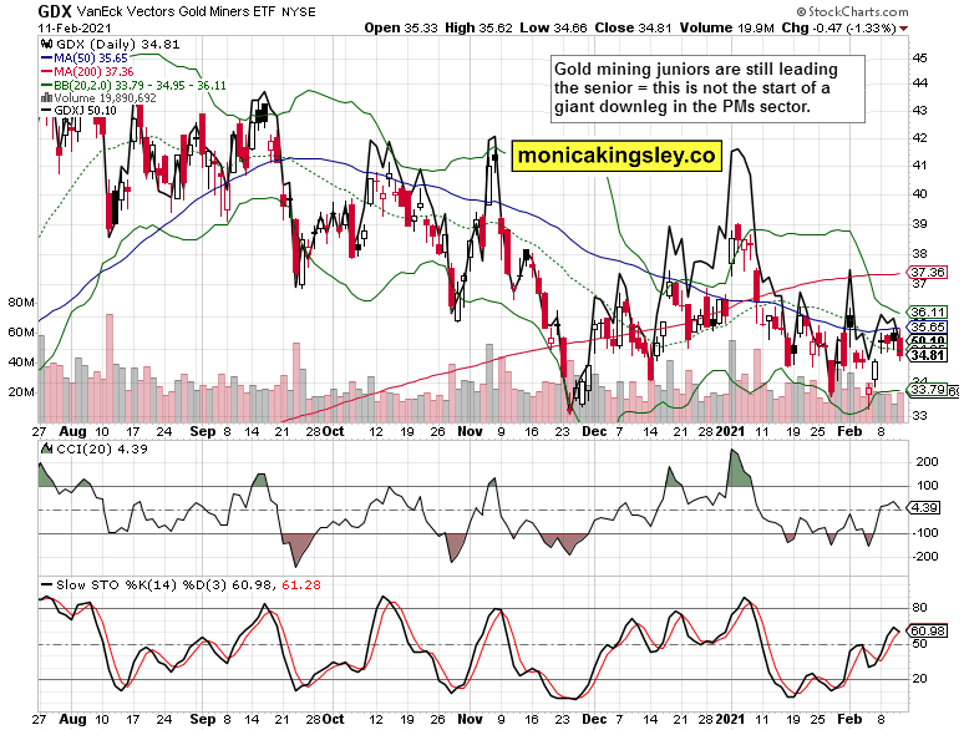
Gold juniors (black line) keep their relative strength vs. the senior gold miners, and the mining sector keeps sending bullish signals, especialy when silver miners enter the picture.
Summary
The stock market tremors aren‘t over, and the signs of deterioration keep creeping in. The bull run isn‘t however in jeopardy, and there are no signals thus far pointing to an onset of a deeper correction right now.
The gold bulls find it harder to defend their gains, unlike the silver ones. That‘s the short-term objective situation, regardless of expansive monetary and fiscal policies, real economy recovery, returning inflation and declining U.S. dollar. The new upleg keeps knocking on the door, and patience will be richly rewarded.
Author

Monica Kingsley
Monicakingsley
Monica Kingsley is a trader and financial analyst serving countless investors and traders since Feb 2020.


