Soybean Elliott Wave technical analysis [Video]
![Soybean Elliott Wave technical analysis [Video]](https://editorial.fxstreet.com/images/Markets/Commodities/Agriculture/soybean1-637443204449862158_XtraLarge.jpg)
Soybean Elliott Wave analysis
Soybean prices continue their sideways recovery from August 2024. While they have gained about 5%, the dominating path since June 2022 remains to the downside, and prices might just turn lower again soon.
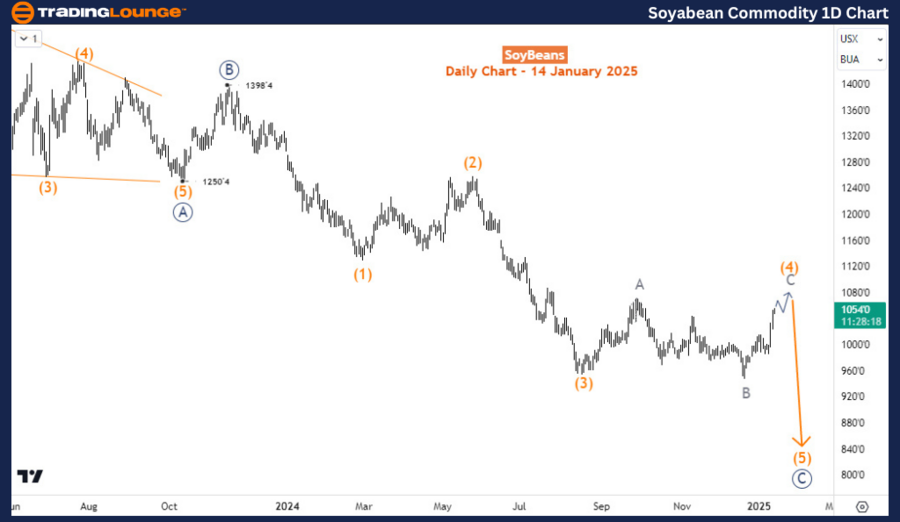
The daily chart analysis
After completing a 5-wave advance between May 2019 and June 2022 when the price improved from barely $790 to $1787, the commodity has been on the opposite side since then. Based on the Elliott wave theory, a 3-wave correction follows a 5-wave trend. The 3-wave bearish correction started in June 2022 is labeled in the primary degree. Wave ((A)) ended in October 2024 with a diagonal structure at 1250 while wave ((B)) finished with a zigzag structure at 1398. As the daily chart shows, wave ((C)) is ongoing. The current bounce from August 2024 should be wave (4) of ((C)). After wave (4), the commodity should return lower in (5) to finish ((C)) and then a long-term recovery could begin.
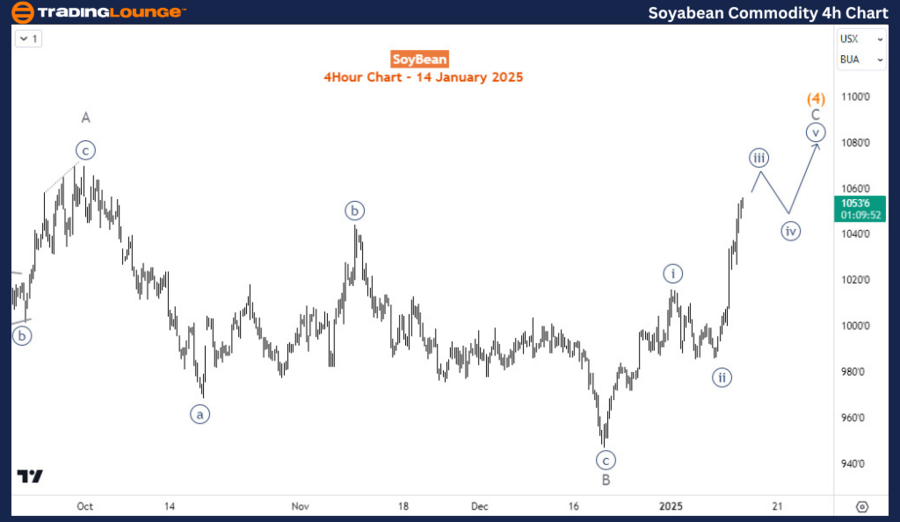
The four-hour chart analysis
On the H4 chart, wave (4) is evolving as a flat structure—a 3-3-5 corrective sequence that’s often sideways in appearance. Wave C of (4) is on course to finish a 5-wave structure - most likely an impulse wave. Price is still in ((iii)) of C of (4) which means the upside is still favored in the short term. However. The upside may correction may not last too long before the 2.5-year sell-off resumes.
Soybean Elliott Wave technical analysis [Video]
Author

Peter Mathers
TradingLounge
Peter Mathers started actively trading in 1982. He began his career at Hoei and Shoin, a Japanese futures trading company.


