|

Sony Corporation (NYSE: SNE) Impulsive Structure Since 2012

Sony Corporation (NYSE: SNE) is a Japanese multinational conglomerate corporation. The Company has a diversified business primarily focused on the Electronics, Games, Entertainment and Financial Services.

In this article, we’ll be looking at the technical Elliott Wave structure of the stock since late 2012 after a significant drop in Yen value which helped  the Japanese stock market to start a recovery.

SNE have been rallying in the recent 7 years with an impulsive Elliott waves structure and the incomplete bullish sequence is still suggesting further upside for the stock as long as 2016 pivot at $19.9 holds. We use our proprietary pivot system to tell us when a cycle has ended & when we need to switch to a different degree, therefore Sony can still aim higher for $65 – $73 area before another correction takes place.

Sony SNE Weekly Chart

SNE

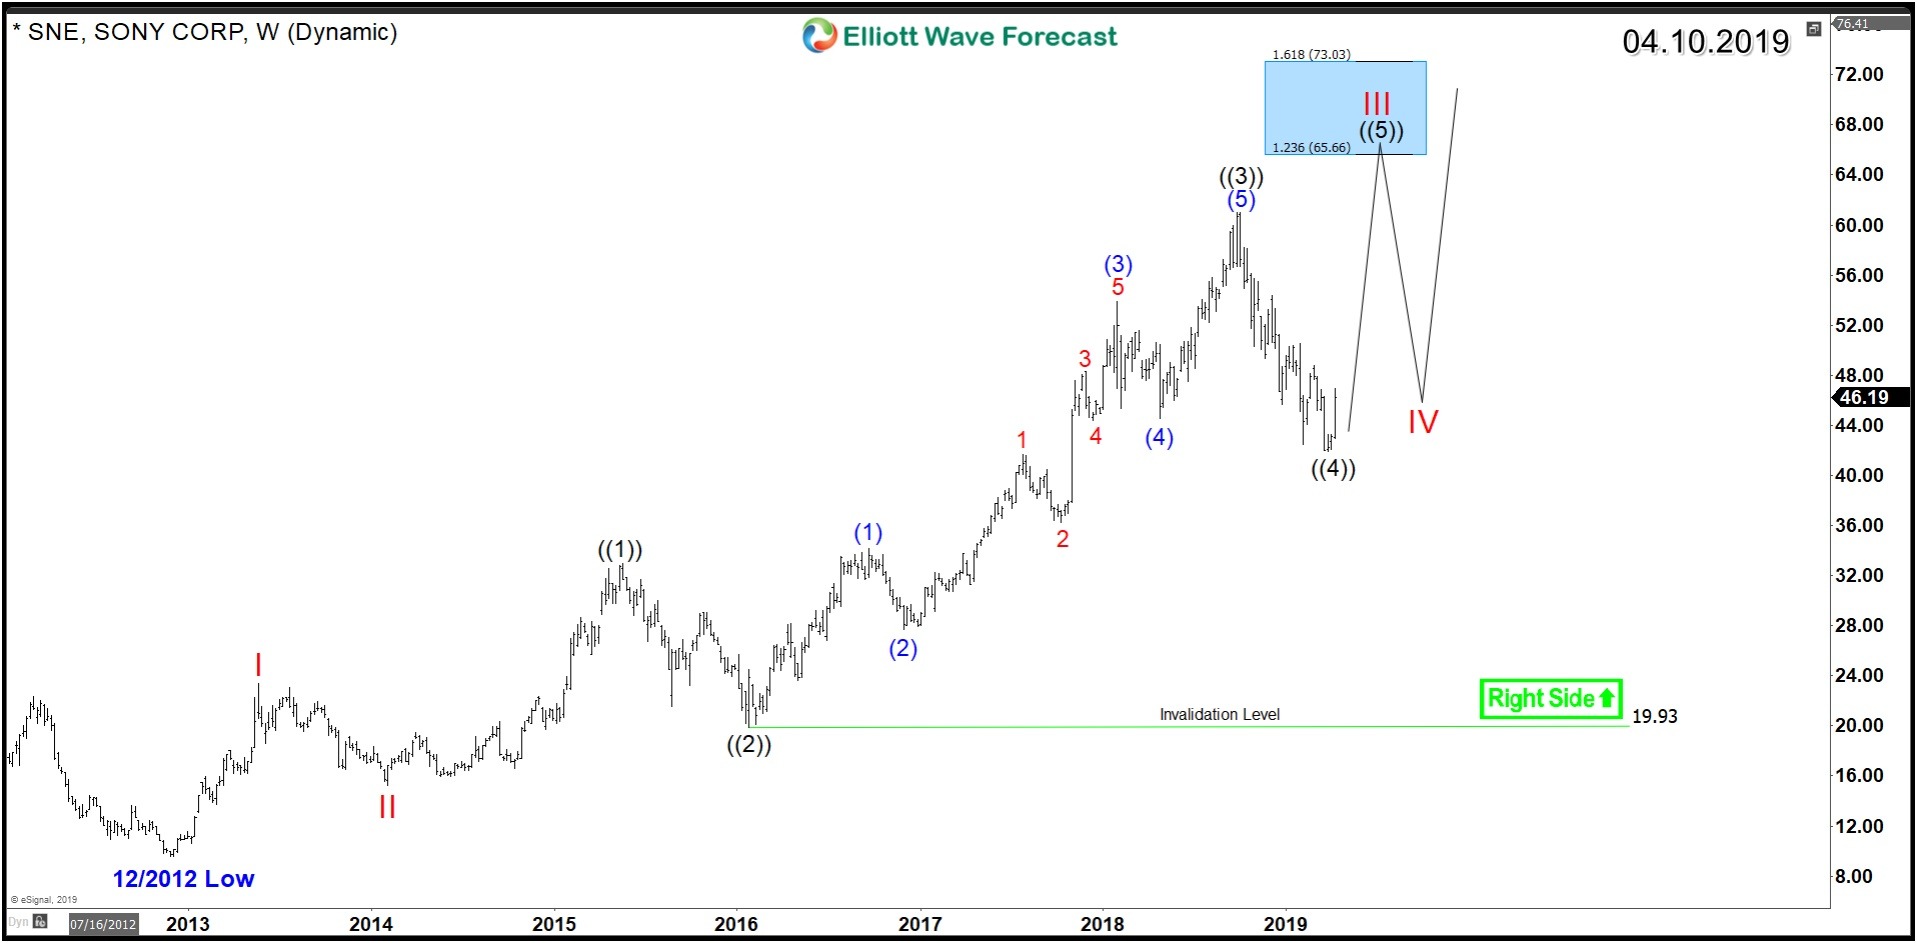
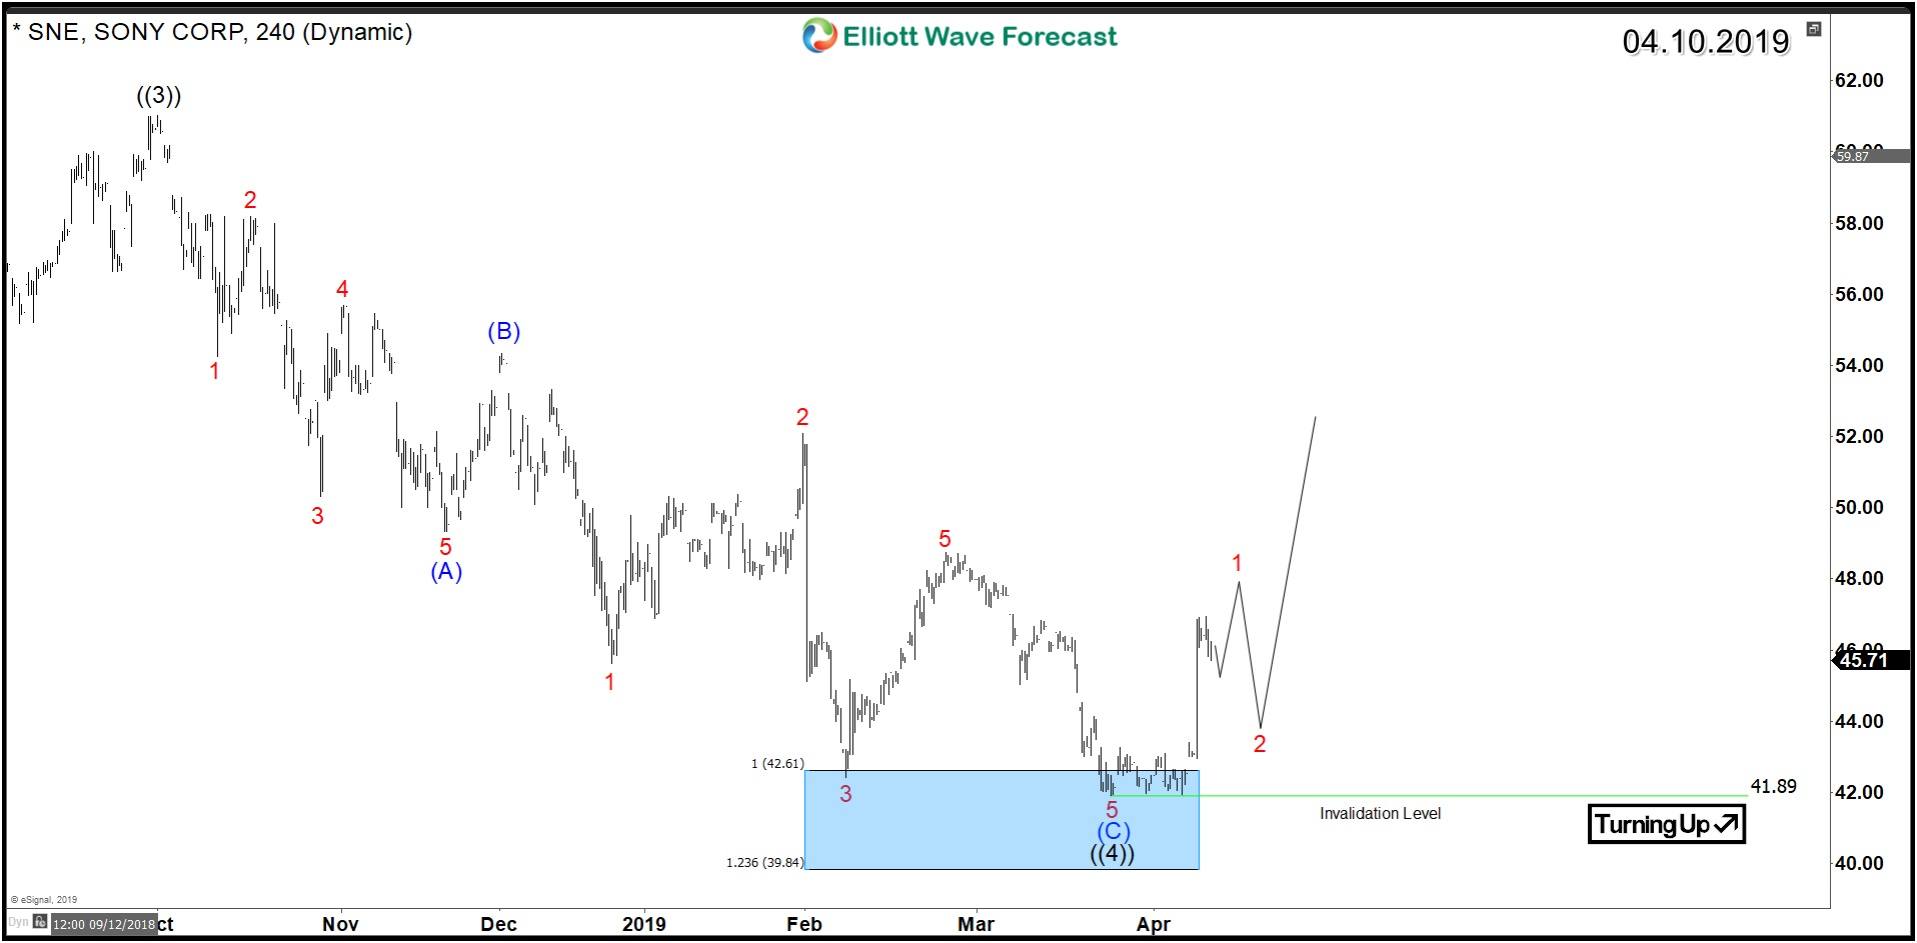
Since October 2018, the stock corrected lower in a classical 3 waves zigzag structure and reached the extreme blue box area $42.6 – $39.8 which is a High-frequency area where markets are likely to end cycles and make a turn. Up from there, SNE started bouncing higher ending the cycle from the peak and initially resuming the main daily bullish trend or doing a 3 waves bounce at least.

Sony SNE 4H Chart

SNE

Recap:

Sony impulsive structure since 2012 will remain intact as long as pivot at 2016 low $19.9 holds and short term support stands at March 2019 low $41.9. Consequently, the stock can see a recovery back toward $51 – $53 to clarify the short term structure then it can attempt to break 2018 peak.


Become a Successful Trader and Master Elliott Wave like a Pro. Start your Free 14 Day Trial at - Elliott Wave Forecast.

Author

Elliott Wave Forecast Team

Elliott Wave Forecast Team

ElliottWave-Forecast.com

More from Elliott Wave Forecast Team
Share:

Editor's Picks

EUR/USD: US Dollar to remain pressured until uncertainty fog dissipates

Unimpressive European Central Bank left monetary policy unchanged for the fifth consecutive meeting. The United States first-tier employment and inflation data is scheduled for the second week of February. EUR/USD battles to remain afloat above 1.1800, sellers moving to the sidelines.

GBP/USD softens to near 1.3600 as BoE hints further rate cuts

The GBP/USD pair loses ground to near 1.3610 during the early Asian session on Monday. The Pound Sterling softens against the Greenback amid growing expectations of the Bank of England’s interest-rate cut. Traders will take more cues from the Fedspeak later on Monday.

Gold eyes acceptance above $5,000, kicking off a big week

Gold is consolidating the latest uptick at around the $5,000 mark, with buyers gathering pace for a sustained uptrend as a critical week kicks off. All eyes remain on the delayed Nonfarm Payrolls and Consumer Price Index data from the United States due on Wednesday and Friday, respectively.

Top Crypto Gainers: Aster, Decred, and Kaspa rise as selling pressure wanes

Altcoins such as Aster, Decred, and Kaspa are leading the broader cryptocurrency market recovery over the last 24 hours, as Bitcoin holds above $70,000 on Monday, up from the $60,000 dip on Thursday.

Weekly column: Saturn-Neptune and the end of the Dollar’s 15-year bull cycle

Tariffs are not only inflationary for a nation but also risk undermining the trust and credibility that go hand in hand with the responsibility of being the leading nation in the free world and controlling the world’s reserve currency.

Bitcoin, Ethereum and Ripple consolidate after massive sell-off

Bitcoin, Ethereum, and Ripple prices consolidated on Monday after correcting by nearly 9%, 8%, and 10% in the previous week, respectively. BTC is hovering around $70,000, while ETH and XRP are facing rejection at key levels. Traders should be cautious: despite recent stabilization, upside recovery for these top three cryptocurrencies is capped as the broader trend remains bearish.