$SMI: Swiss market index SMI provides an opportunity in a pullback

SMI is a Swiss Market Index representing a capitalization-weighted measure of the 20 most significant stocks on the SIX Swiss Exchange in Zurich; the ticker is $SMI. The “COVID-19” drop in indices in February-March 2020 has marked most probably a significant low in world indices. It seems like $SMI has also found its bottom on march lows at 7648.5 and is now looking higher.
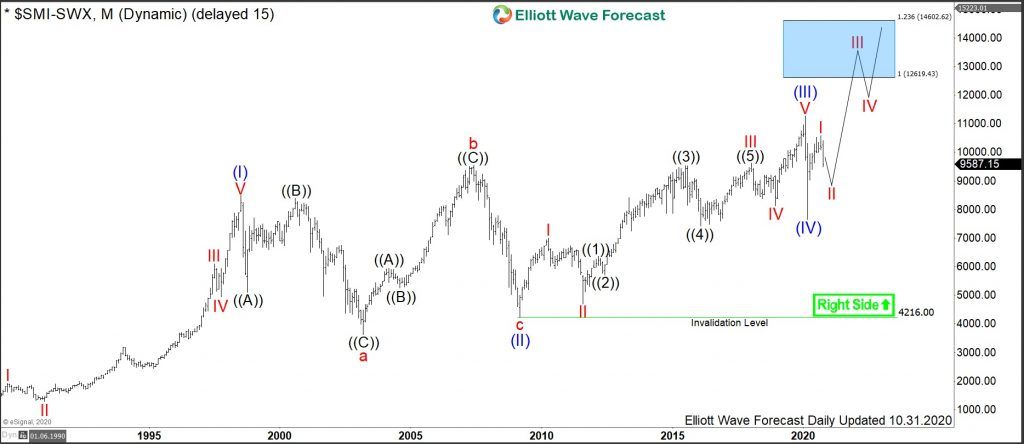
SMI Monthly Elliott Wave Analysis 11.02.2020
The monthly chart below shows the SMI index $SMI listed at SIX Swiss. From the all-time lows, the index price has developed a cycle higher in wave (I) of a super cycle degree. It has ended by printing a high in July 1998 at 8491. From the highs, a correction lower in wave (II) has retraced during following 10 years a half of the of the motive cycle higher towards March 2009 lows at 4216. Technically speaking, the decline can be seen as an Elliott Wave running flat pattern.
From the lows at 4216, another cycle higher in wave (III) has been confirmed by breaking 8491 highs. Later on in February 2020, it has printed the all-time highs at 11272. From the highs, a sharp decline in wave (IV) has unfolded as a straight down correction. It has found its bottom in March 2020 at 7648.5. While above there, SMI might be now in the early stages of the wave (V). As a target, expect the price to extend towards 12619-14602 area and even higher.
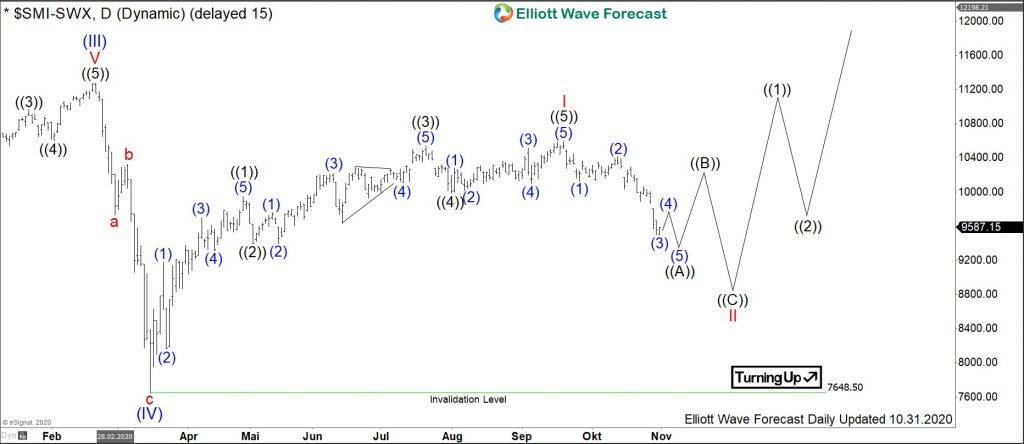
SMI Daily Elliott Wave Analysis 07.08.2020
The daily chart below shows in more detail the advance higher in wave I of (V) and the first leg lower of the pullback in wave II. From the March lows, wave I demonstrates clearly the subdivisions of 5. In fact, this number of 5 is a characteristic feature of the motive waves. Within wave I, there are 5 black subwaves ((1))-((5)). These in turn subdivide similarly into 5 blue waves (1)-(5). Since the price has broken below the price trendline, the March cycle has ended in September 2020 at 10593 highs.
From the September highs, pullback in wave II has started and should find support in 3, 7, 11 swings above 7648.5 for an extension higher in wave III of (V). In shorter cycles, a first leg lower in wave ((A)) of II is currently in progress. Once finished, the bounce in wave ((B)) should fail below 10593 highs for another leg lower in wave ((C)). Later on, investors and traders can buy SMI against 7648.5 lows for an extension higher in waves III-V of (V) looking towards 12619-14602 area and even higher .
Author

Elliott Wave Forecast Team
ElliottWave-Forecast.com


