Silver’s boring box vs Dollar’s hidden reversal setup
Markets are quiet on the surface… but technically, things are far from boring.
Silver’s stuck in a box, gold’s hesitating near key supports, and the U.S. Dollar is hinting at a powerful reversal setup that could flip everything upside down or confirm the recent trend.
This update will guide you through the decision zones and show you exactly what to watch next.
Silver’s sideways grind continues
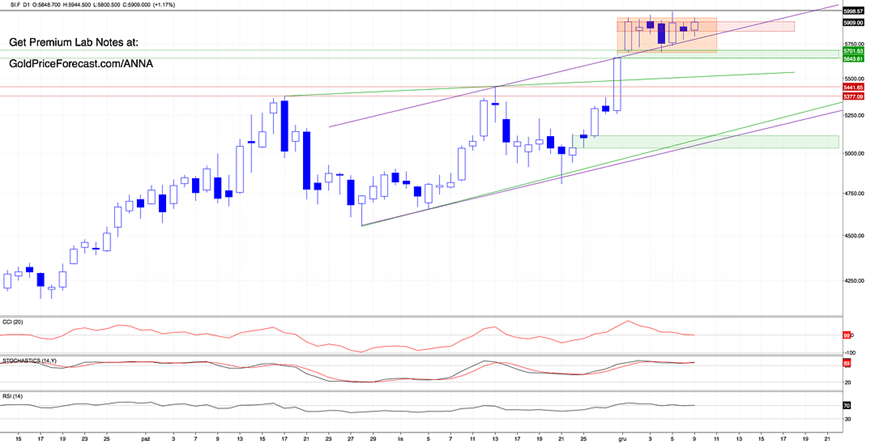
Silver (SI.F) H4: Still Boring? Maybe. Still Important? Absolutely.
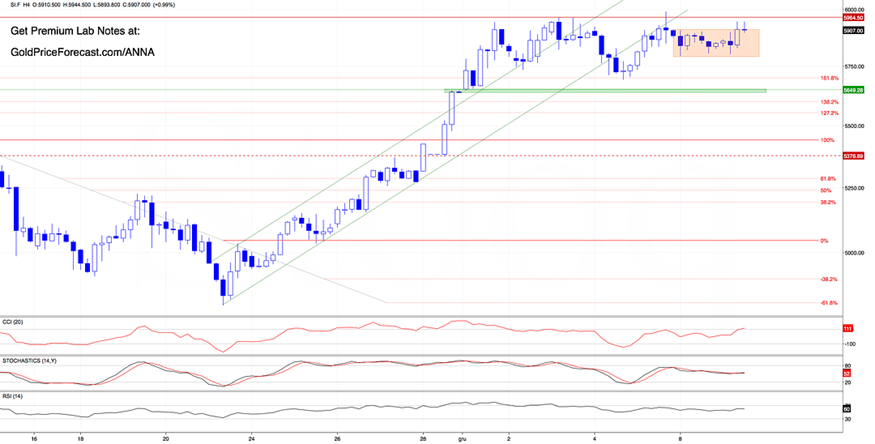
Let’s be honest - nothing has really changed on this chart. Silver remains inside its short-term orange consolidation zone, and both the key resistance (near 6000) and the short-term support (marked on the daily chart below) remain exactly where they were yesterday.
So, how do we make this useful?
Even if silver isn’t moving yet, the greenback is. And the U.S. currency strength or weakness is often the spark that gets metals moving again. So, while silver traders are waiting for a clean breakout, they should keep an eye on the USD because that’s where the signal might come from next.
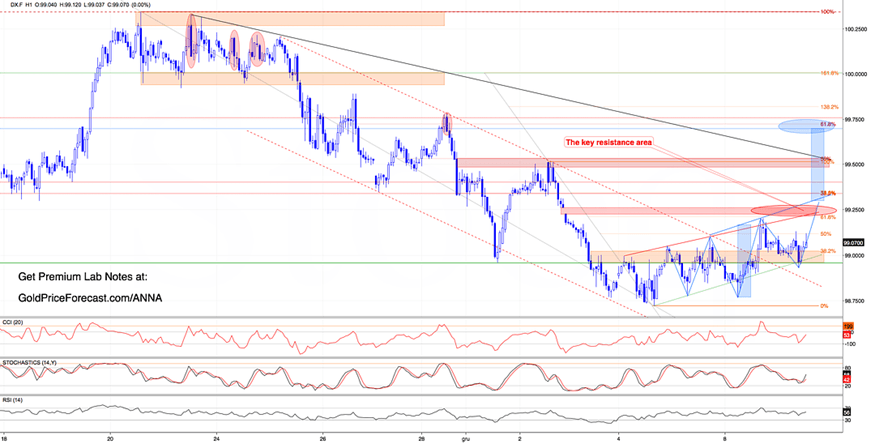
The U.S. Dollar Index (DX.F) H1 - Bulls Hit Resistance… But Is This a Setup in Disguise?
Yesterday, we wrote:
“(…) This is a classic “test of conviction” moment. A clean close above that red gap zone would unlock targets around 99.40-99.50, (…)
Nevertheless, the hourly indicators are heavily overbought. If bulls hesitate here, we could see a reversal and a classic retest of the previously broken upper line of the red channel (…)”
A reversal pattern takes shape
Well… bulls tried, but they got rejected slightly below that red resistance cluster. And what followed? A pullback into the highlighted support zone, as expected.
But here’s where it gets interesting:
- The breakout above the red declining channel from earlier this week is still intact.
- Oscillators are now generating fresh buy signals, as the market is pulling back from overbought levels.
- And there’s more… a potential inverse head & shoulders formation is building.
This is a classic reversal setup but here’s what needs to happen next to activate it:
- Step 1: Breakout above that red resistance zone (which stopped buyers yesterday) again. That’s the first gate, which is still defined by: the 61.8% Fibonacci retracement of last week’s drop + the red resistance line based on recent local tops + the still-open bearish gap.
- Step 2: Confirmation of the breakout above the neckline around the 99.35-99.40 zone.
Why is this zone critical?
Because it combines two important Fibonacci retracements: 38.2% of the entire Nov.20-Dec.5 downward move and 78.6% of the December drop and
- Step 3: If that level breaks...
- target #1: around 99.50 (combination of the 50% Fibonacci retracement + December highs + black declining resistance line)
- target #2: around 99.70, where the projected size of the H&S formation lands and where we also find the 61.8% retracement of the full November-December decline and the bearish engulfing candlestick formation from Nov.28
My takeaway for today: the USD Index has cooled off just enough to give bulls another shot, but the red resistance zone is the battlefield. Watch for signs of strength (or failure) in that exact 99.21-99.26 area -> this will likely determine whether gold and silver break up or down from their current ranges. If bulls regain momentum and push through the neckline -> expect metals to turn lower again as the USD rallies.
Want free follow-ups to the above article and details not available to 99%+ investors? Sign up to our free newsletter today!
Author

Anna Radomska
Sunshine Profits
Anna's passion for drawing evolved into a fascination with colorful lines and shapes, which later inspired her interest in the stock market.


