Silver - The Next Cyclical Superstar?

Silver could turn out to be the true superstar within the precious metals complex. There are no new inventions around silver that lead to this conclusion. It is based on technical analysis. Silver behaved like gold on steroids. The swings in both metals went into the same direction but had a far bigger magnitude in silver. There is no obvious reason why this behavior is unlikely to continue in the near future. The technical picture suggests that both assets are ripe for a rally very soon. Silver could outperform once again.
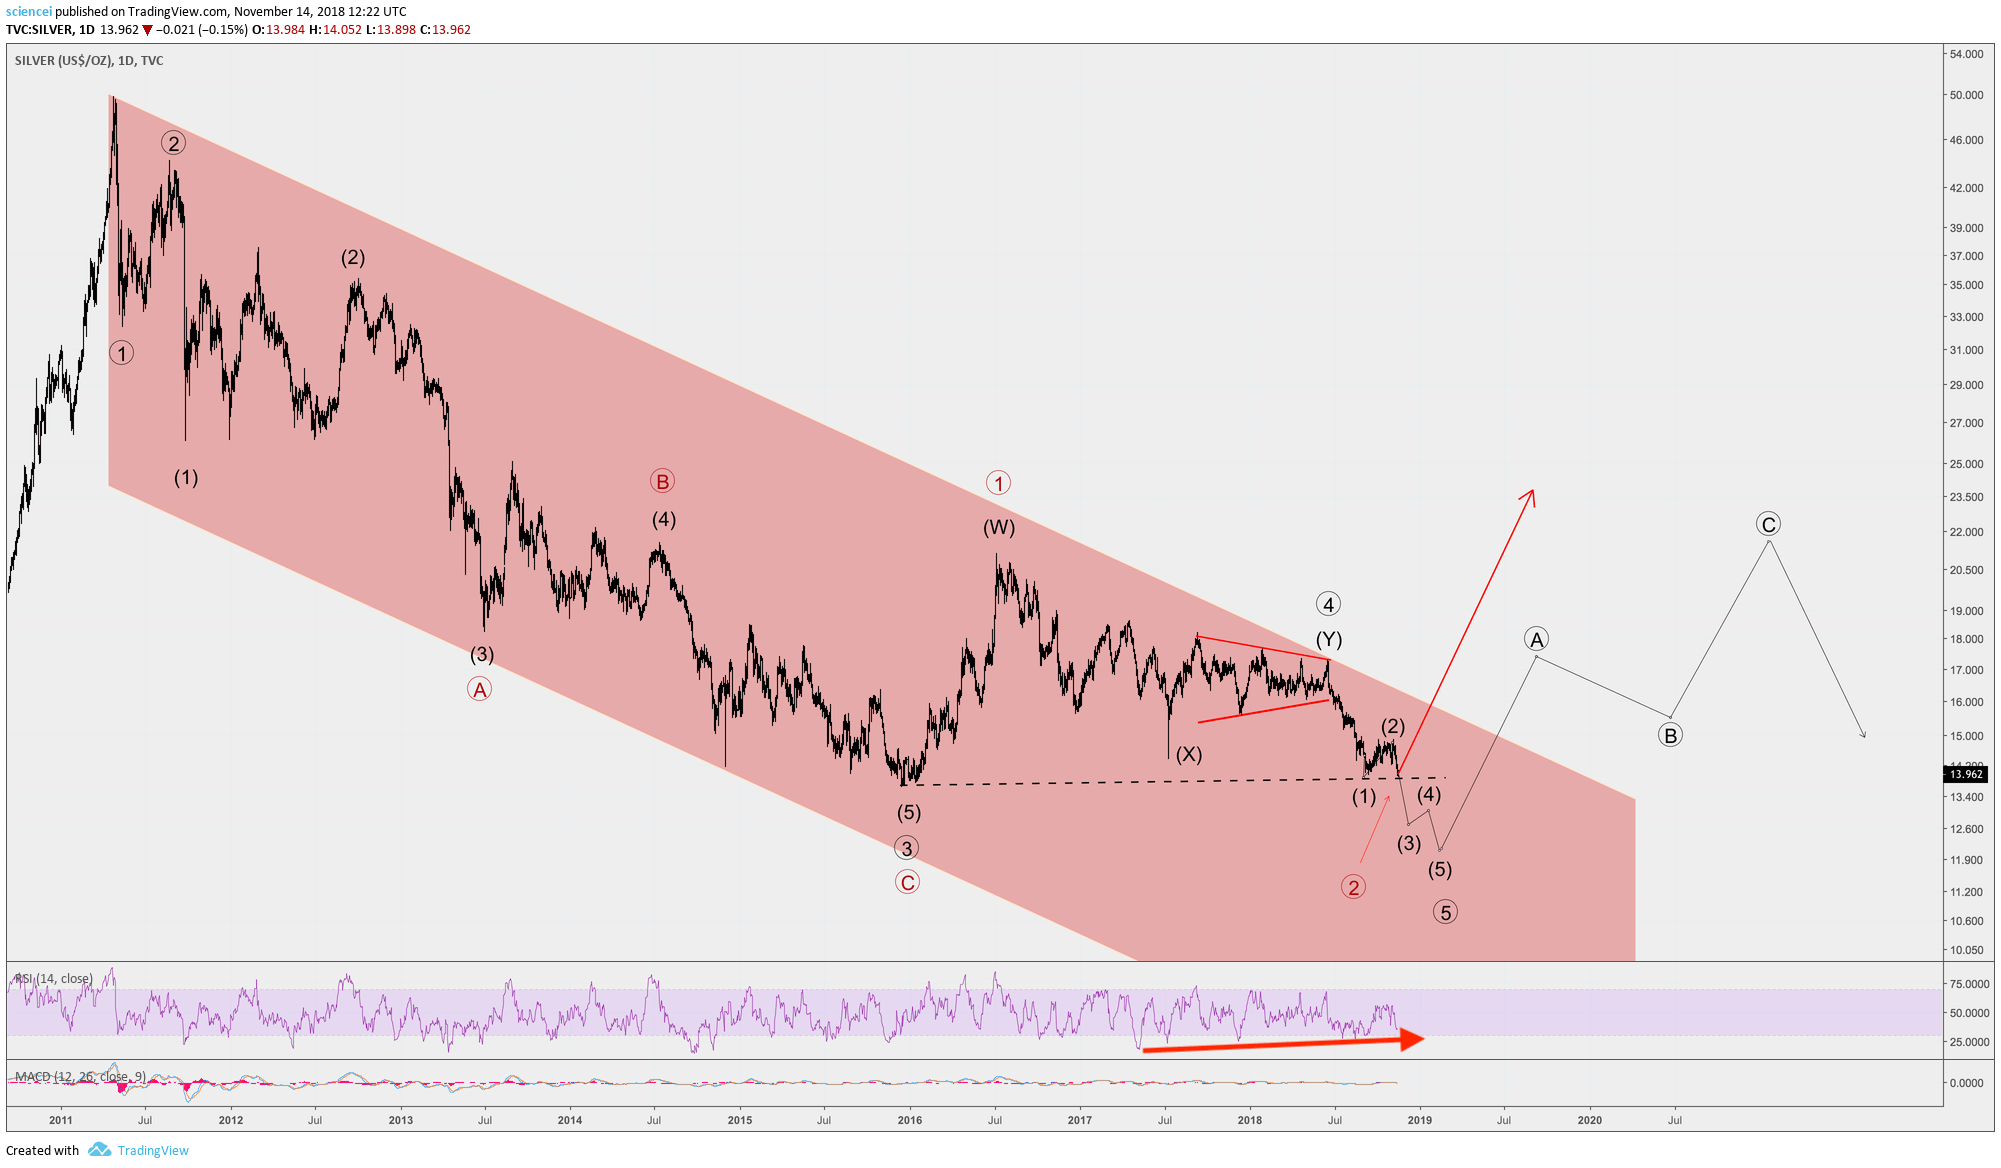
There are some parallels between silver and gold with regard to their technical structure. Both unfolded a bearish trend from the highs in 2011. The red channel depicts the bear trend that dominated silver during the past few years. Roughly speaking, the last third of that trend is ambiguous. Silver unfolded a complex structure since late 2015. It appears trendless from that point in time until today. This is more or less analogous to gold. Moreover, price action in silver shows divergence during the past couple of years. This simply means that it is losing selling pressure. Moreover, we have recently seen very depressed sentiment and position readings throughout the precious metal spectrum. All in all, these are technical signs that silver is close to a significant bottom.
The last major bottom was roughly around 13.65 in late 2015. Recent action can be considered as a technical retest of that bottom. It is ambiguous whether the retest holds or not at this point in time. The long-term graph consists of two scenarios, which are perfectly valid within the Elliott wave framework. The black scenario shows the probable path if the low from 2015 does not hold. Its implication is that a final fifth wave unfolds to the downside. Eventually, the rubber band reaches a reversal and ignites a corrective rally. This correction will be retracing some proportion of the entire trend that unfolded since 2011. Hence, it is most likely sizable and results into a double-digit gain after another low.
The red path is the best alternative interpretation within the Elliott wave framework. The late 2015 bottom holds during the current retest within the red scenario. This implies that the pale red trend channel ended in 2015. Moreover, it means that silver is within a new trend to the upside, which is not clearly visible yet. Most importantly, it indicates that the rubber band snaps earlier to the upside into a big bull run.
All in all, the Elliott wave framework slightly favors the black scenario as it fits more of its rules and guidelines. However, it needs to run through the 13.65 mark first. This makes the technical setup particularly interesting for silver at this point. A bullish scenario, as depicted by the red path, is perfectly possible within the Elliott wave framework. It gets invalidated at roughly 13.65. This is less than 3% away from the silver market price as we submit this article. The setup translates into a favorable risk/reward profile. Opening a buy-and-hold position is less than 3% away from getting invalidated. The potential reward is at least 50% upside if silver saw its bottom in 2015. Leaving execution risk out out the equation, risking 3% for a potential double-digit gain is an asymmetric investing opportunity with a contrarian flavor to it.
Interested in more of our ideas? Check out Scienceinvesting for more details!
Interested in more of our ideas? Check out Scienceinvesting for more details!
Author

Science Investing Team
Science Investing


