Silver holders can lose the solar growth story and keep the shortfall

America installed 45% more solar this spring than a year earlier, every one of those panels locks its silver away for decades, and even the deepest cut to solar demand I have seen leaves the silver market short for a sixth year.
The two things a long-term silver holder needs from solar both survive this year. The market stays short: even on J.P. Morgan's estimate, the deepest cut I have seen, the shortfall that Metals Focus and the Silver Institute forecast for 2026 roughly halves and does not disappear. And silver that has gone into a panel stays there for decades, so every installation adds to a stock that never returns to the market. What does not survive is the growth story. The solar case sold to silver buyers over the past three years was about volume: more panels, more silver. The volume half is holding. The silver half is not, because each panel carries less silver than the one before, and that is bad for this year's balance. The reading is settled in November, when Metals Focus publishes its interim update.
Silver closed at $65.06 an ounce on September 23 against gold at $4,304.11, a gold-silver ratio of 66.2. Silver fell about 3% on the day and gold 1.2%. The trigger was two regional Fed presidents saying the case for further tightening remained after last week's quarter-point rise. Early trading on September 24 took silver lower still, near $64. Silver is about 9% below where it started 2026. It is roughly 46% below its January peak of $121.58. The Federal Reserve raised its policy rate on September 16 to 3.75% to 4.00% and projected one more increase this year. The market now prices that further increase before the year ends. The Golden Meadow® research this article draws on has followed the solar demand line closely for two years. This year's numbers changed what it shows.
The United States installed 11.4 GW of solar in a quarter, up 45%, while J.P. Morgan sees photovoltaic silver demand falling about 60 Moz
Solar installation in the United States had a very large quarter this spring, and the reason is a deadline. On September 10 the Q3 2026 US Solar Market Insight from SEIA and Wood Mackenzie reported 11.4 gigawatts installed in the second quarter, up 45% on a year earlier. Utility-scale projects, the large solar farms that supply the grid, made up 9.6 gigawatts of that and grew 61%. Developers are putting projects into service before two federal tax credits expire. Projects that locked in the credits ahead of the deadline are being finished now. The smaller segments show what happens when a credit has already gone: residential installations fell 12% and community solar fell 14%. The report raised its outlook for the next five years by only 1.2%, which its authors describe as essentially flat.
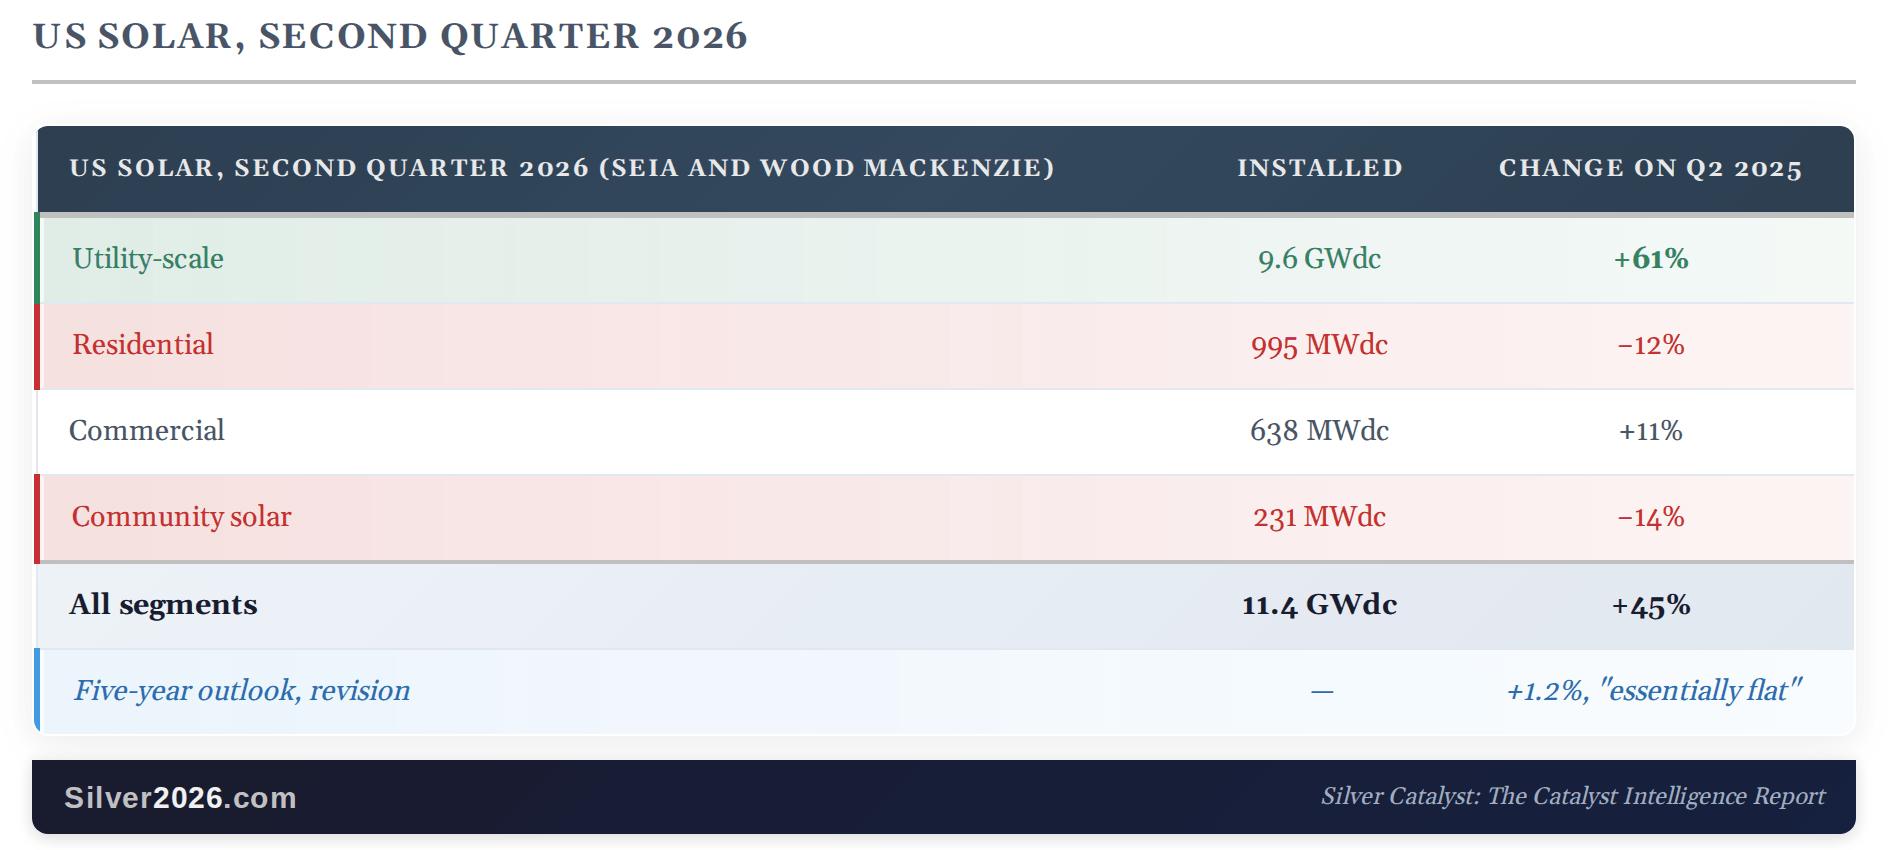
Sources: SEIA and Wood Mackenzie, Q3 2026 US Solar Market Insight
Segment figures are as reported and rounded; they sum to slightly more than the stated total.
China supplies the other half of the picture. Its National Energy Administration reported that installed solar capacity reached 1,286 gigawatts at the end of July, passing coal-fired capacity for the first time. That is a milestone for the fleet already built. New additions tell a different story: the previous issue recorded that China's January-to-July additions were 61.4% below the same period of 2025.
Installation volume, then, is holding up. The silver in it is not. Solar cells use silver paste for the fine lines that carry current off the cell. At this year's prices manufacturers have cut the amount in every cell. Metals Focus and the Silver Institute forecast photovoltaic silver demand, the silver used in solar cells, at about 151.0 Moz for 2026, down from 186.6 Moz in 2025. On August 13, J.P. Morgan's research page carried a lower estimate from Gregory Shearer, the bank's head of base and precious metals strategy. Solar silver demand, he said, could fall by around 30% this year, a reduction of roughly 60 million ounces. Two cautions travel with that figure. It is a verbal estimate on a research page rather than an entry in a published forecast table. And the Silver Institute has not adopted it. It is also the lowest estimate this newsletter has worked with, which is exactly why it is the right one to test the deficit against.
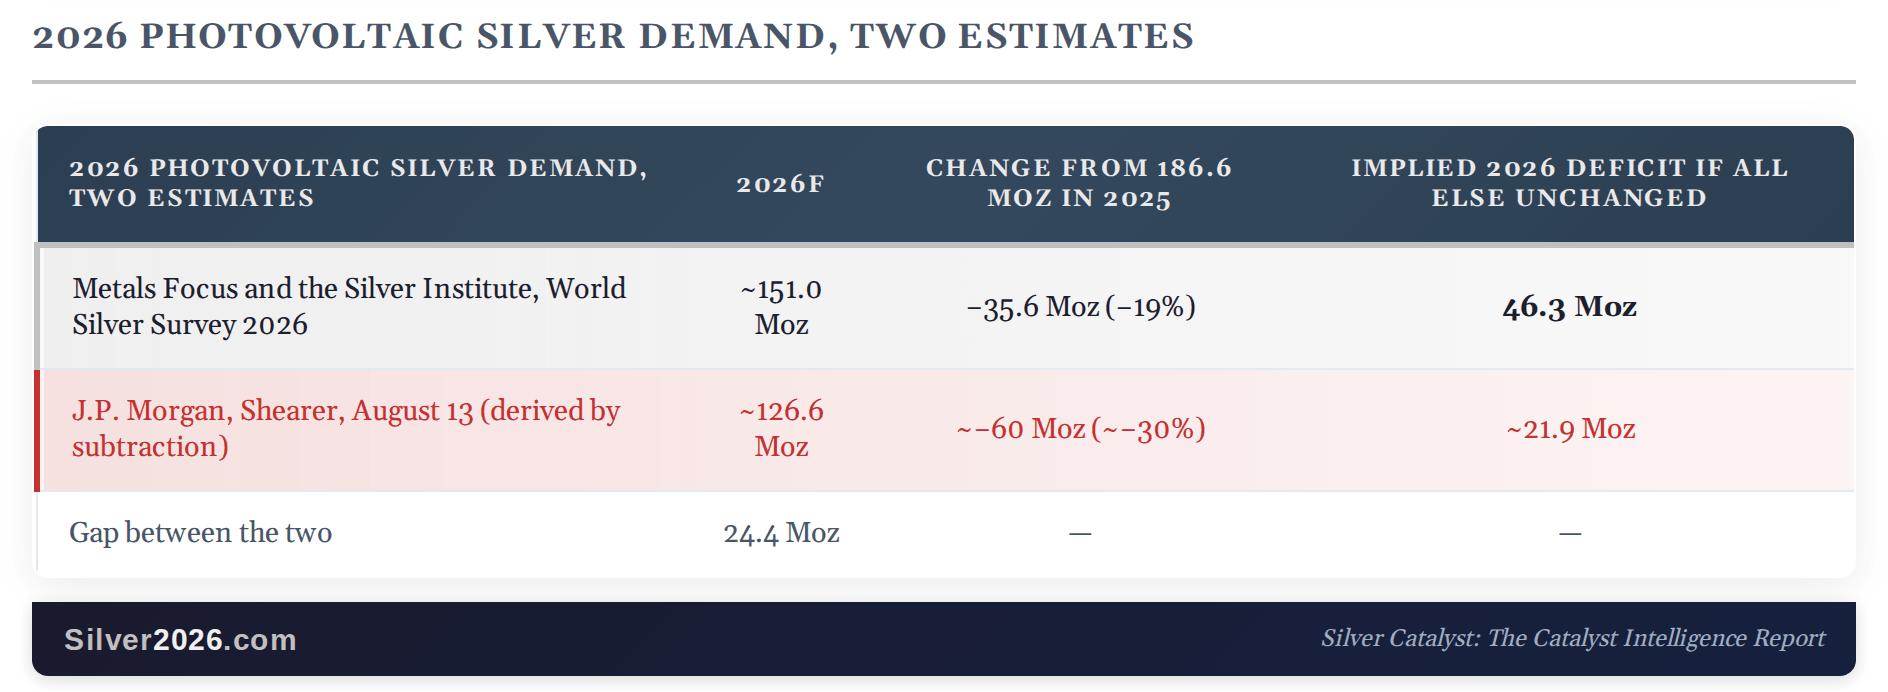
Sources: World Silver Survey 2026, Metals Focus and the Silver Institute | J.P. Morgan Global Research, silver, August 13, 2026 | SEIA and Wood Mackenzie, Q3 2026 US Solar Market Insight
The 126.6 Moz in the table is my subtraction of 60 from 186.6, and it should be read as such. If Shearer is right and every other line in the survey's balance holds, the 2026 deficit narrows from 46.3 Moz to roughly 21.9 Moz. The survey's other lines will not all hold, so that figure is a sensitivity rather than a forecast. It is still a deficit. BloombergNEF now expects solar silver demand to fall for a second straight year. Its own earlier figure for 2026 was near 194 Moz, on a higher starting point. The cutting is driven by cost. Metals Focus and the Silver Institute put silver at 8% to 10% of the cost of a solar cell at the start of 2025, and at over 20% by the end of it. The credible range for this year now runs from roughly 127 Moz to roughly 194 Moz. The survey's forecast sits between them. The three are not built on the same 2025 starting point, so the gaps between them overstate the disagreement.
Two conversions put the installation numbers in silver terms, with the assumptions stated. The first is the American quarter. Its 11.4 gigawatts embed roughly 2.5 Moz of silver at this year's silver content per gigawatt. That content, about 6.7 tonnes per gigawatt, is a working figure rather than a published one. It is the survey's 151 Moz forecast divided by an assumed 700 gigawatts of cell production this year. The survey itself expects mainstream cells to fall below 5 milligrams per watt by 2027, which is the same as 5 tonnes per gigawatt. Silver Rising used a range that started at 12 tonnes per gigawatt. At that rate the quarter embeds about 4.4 Moz. Either way, that metal was consumed when the cells were made, mostly in Asia and mostly in earlier quarters. A strong installation quarter confirms demand that has already happened rather than adding new demand. The second is China's fleet of 1,286 gigawatts. It was built when panels carried far more silver than today, at 10 to 15 tonnes per gigawatt. At those rates the fleet embeds roughly 410 to 620 Moz. That silver is a stock, sealed into panels for twenty-five years or more. It is the physical basis of the one solar claim that survives this year unchanged: silver already installed does not come back.
What this means to Silver investors
For this year's balance, the numbers are worse than the growth story promised, and it is better to say so plainly. The volume argument that opened the solar chapter of Silver Rising is two years stale. Panels are going up at close to last year's pace worldwide. BloombergNEF's global estimate for 2026 is 649 gigawatts, barely below 2025's 655. Each of those panels carries less silver than the one before. On the survey's own forecast, solar silver demand falls 19% this year. On the lowest published estimate it falls by around 30%. A deficit that halves is a different market from a deficit that widens. The assumption that solar demand grows every year no longer holds.
Two things survive, and they are the two a long-term holder needs. The first is that the market stays short even on the lowest published estimate. The shortfall shrinks to roughly 21.9 Moz from 46.3 Moz. It is still a shortfall, and it runs into the sixth consecutive year of deficit on the figures from Metals Focus and the Silver Institute. The longer-term case for silver rests on that shortfall persisting, not on any single demand line growing. The second is the stock argument. Every gigawatt installed this year locks its silver away for a quarter of a century. The fleet already built holds hundreds of millions of ounces, and none of it returns to the market within any holder's investment horizon. Thrifting, the cutting of silver per cell, slows the rate at which new silver is locked away. It does not release any of the silver already locked. The survey notes that recycling from old panels remains small in volume.
The cutting has further to run, and the survey says so. Metals Focus and the Silver Institute expect silver per cell to fall by a further 15% to 20% this year. The full replacement of silver with copper is a different matter. Copper electroplating, which lays copper onto the cell in place of silver paste, is in pilot production. The survey says yield and reliability problems mean mass production of pure copper pastes is unlikely this year. Its own view is that silver will remain essential to the industry, with a defensible place in high-reliability cells. So the substitution story has a direction and no date. The checkpoint that does have a date is the Metals Focus interim update in November. It will show whether the survey's 151 Moz or J.P. Morgan's lower figure was closer, and the answer will be graded in print either way.
Want free follow-ups to the above article and details not available to 99%+ investors? Sign up to our free newsletter today!
Author

Przemyslaw Radomski, CFA
Gold Price Forecast
Przemyslaw Radomski, CFA (PR) is a precious metals investor and analyst who takes advantage of the emotionality on the markets, and invites you to do the same. His company, Sunshine Profits, publishes analytical software that any