|

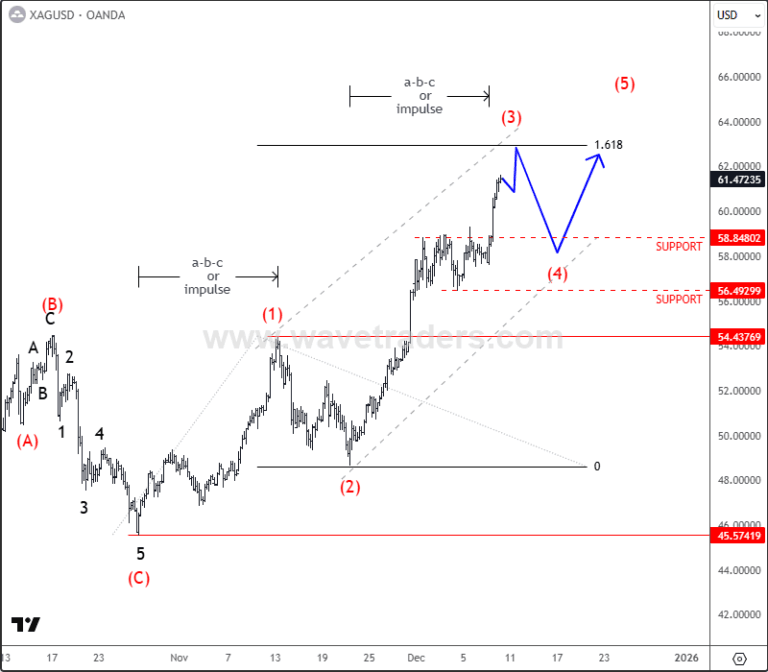
Silver extends gains as wave structure points toward higher levels

Silver broke higher last week pretty sharply and strongly, but gold is not following to the upside that much. However, because of the falling gold–silver ratio, silver is the best performer at this stage, so we are updating the wave counts, which could be a diagonal pattern because the first three legs up from the October lows could represent wave 1 of this five-wave move that can unfold into a wedge formation. However, due to the current strong extension to 61 area within wave 3, it could also be unfolding a five-wave impulse. So, in both cases, it could still grind higher, and it looks like there could be room up to 161,8% Fibo. extension and 62-63 area or higher. On dips, support can be found at the 58-56 area, while the invalidation level is at 54, because if we think we are in an impulse, then wave 4 should not come below wave 1 swing high.

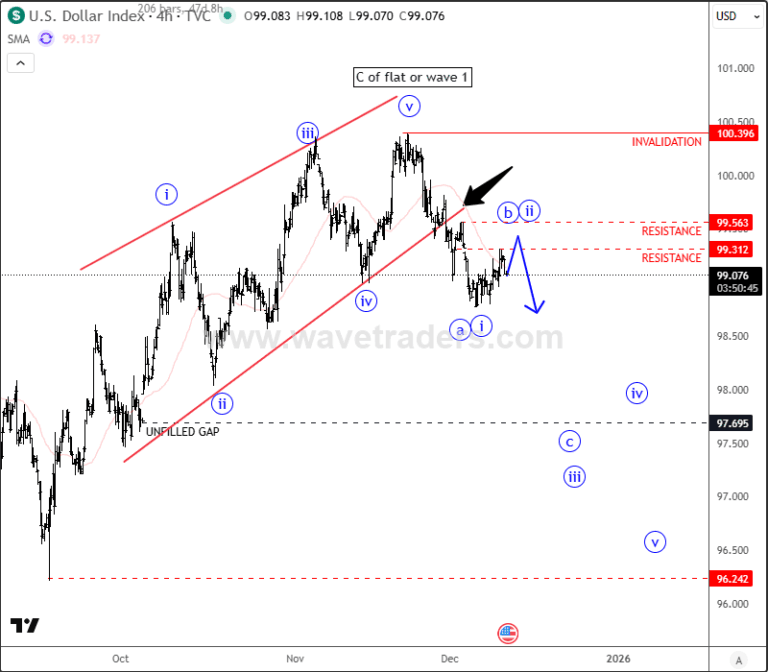
The reason why silver could stay in the uptrend is weakening of the US Dollar Index – DXY. DXY made higher highs and higher swing lows from September when the Fed cut rates, with stock markets being under pressure since expectations for further cuts have decreased. That’s why silver was in consolidation. But this has changed recently, and what’s really important now is that despite this recovery on DXY from September lows, we still see an overlapping wave structure, so it can easily be a five-wave movement that can even represent a diagonal in wave C, meaning a reversal pattern that could send prices lower soon after a completion of the higher-degree wave four. Or it, it can be a leading diagonal, but even in that case we would expect a three-leg pullback that seems underway right now, which can push the price of silver higher.

Thank you for reading and see you on the next one!


Get Full Access To Our Premium Elliott Wave Analysis For 14 Days. Click here.

Author

Gregor Horvat

Gregor Horvat

Wavetraders

Experience Grega is based in Slovenia and has been in the Forex market since 2003.

More from Gregor Horvat
Share:

Markets move fast. We move first.

Orange Juice Newsletter brings you expert driven insights - not headlines. Every day on your inbox.

By subscribing you agree to our Terms and conditions.

Editor's Picks

EUR/USD hovers around 1.1700, US Jobless Claims data eyed

EUR/USD is trading in a range around 1.1700 in European trading on Thursday. The pair's upside remains capped by a pause in the US Dollar decline, led by the less hawkish Fed outcome. Markets await the release of the US weekly Initial Jobless Claims report for further trading incentives. 

GBP/USD struggles below 1.3400 ahead of US employment data

GBP/USD stays defensive below 1.3400 in the European session on Thursday, pressured by a modest US Dollar upswing. Nonetheless, the potential downside might be limited after the US Federal Reserve delivered a rate cut at its December policy meeting. Traders brace for the US weekly Initial Jobless Claims report due later in the day. 

Gold sticks to intraday losses amid modest USD bounce; dovish Fed limits further decline

Gold touches a fresh daily low during the early European session, though it lacks follow-through and rebounds slightly from the $4,200 neighborhood. The US Dollar attracts some buyers and recovers a part of the previous day's post-FOMC slump to its lowest level since October 24.

Solana dips as hawkish Fed cuts dampen market sentiment

Solana price is trading below $130 on Thursday, after being rejected at the upper boundary of its falling wedge pattern. The broader market weakness following the Federal Reserve’s hawkish rate cut has added to downside momentum.

Fed projects only 50 bps of additional rate cuts between 2026 and 2027; lifts GDP forecasts

The Federal Open Market Committee’s (FOMC) latest dot plot, released on Wednesday, indicates that interest rates will average 3.4% by the end of 2026, in line with the September projection.

Solana dips as hawkish Fed cuts dampen market sentiment
Solana (SOL) price is trading below $130 at the time of writing on Thursday, after being rejected at the upper boundary of its falling wedge pattern. The broader market weakness following the Federal Reserve’s hawkish rate cut has added to downside momentum.