Signs of stability to curb the selling, but will it last? [Video]
![Signs of stability to curb the selling, but will it last? [Video]](https://editorial.fxstreet.com/images/Markets/Currencies/Crosses/EURJPY/forex-euro-and-japanese-currency-pair-with-calculator-4580994.jpg)
Market Overview
The spread of the Coronavirus will continue for days/weeks to come. The death toll has gone above a hundred in China and the economic impact on the world’s second largest economy is difficult to predict right now. It is interesting though that the World Health Organisation (the WHO) continues to refrain from declaring the Coronavirus as a global health emergency. Financial markets are often quick to price in events, and there are signs of stability starting to creep back in this morning. The US 10 year Treasury yield held up above 1.600% yesterday and has ticked slightly higher this morning. The flow into safe haven assets such as the yen and gold has also threatened to dry up. Equity indices which felt significant selling pressure yesterday are seeing futures edging back higher today. However, there is a caveat in that markets looked to stabilise early last week before a significant bout of selling kicked in. This suggests caution is still required. The Federal Reserve kick off its two day FOMC meeting today and this could also begin to play into the consolidation.
Wall Street closed sharply lower yesterday with the SP 500 -1.5% at 3243. However, with US futures rebounding by +0.6% today this is helping to steady the selling early today. The Nikkei was -0.6% lower early today whilst in Europe the outlook is looking brighter with FTSE futures +0.4% and DAX futures +0.5% higher. In forex there is something of a mixed mood. Selling through AUD and NZD is far less pronounced whilst CAD is up and the safe haven JPY is giving up some of its gains. In commodities, in keeping with the more encouraging risk environment, gold is back lower by -$4, whilst oil has rebounded from early losses and is now around flat on the day.
There is a big US focus to the economic calendar today. We start with US Durable Goods Orders at 1330GMT which are expected to see the adjusted ex-Transport number to grow by +0.1% in December (after a decline of -0.1% in November). The SP Case-Shiller House Price Index is expected to increase to +2.4% for November (from +2.2% in October). The big data focus for today is the Conference Board’s Consumer Confidence for January at 1500GMT which is expected to improve once more to 128.0 (from 126.5 in December) after having been a little sluggish in recent months. The Richmond Fed Business Index is expected to improve slightly to -3 in January (from -5 in December).
Chart of the Day – EUR/JPY
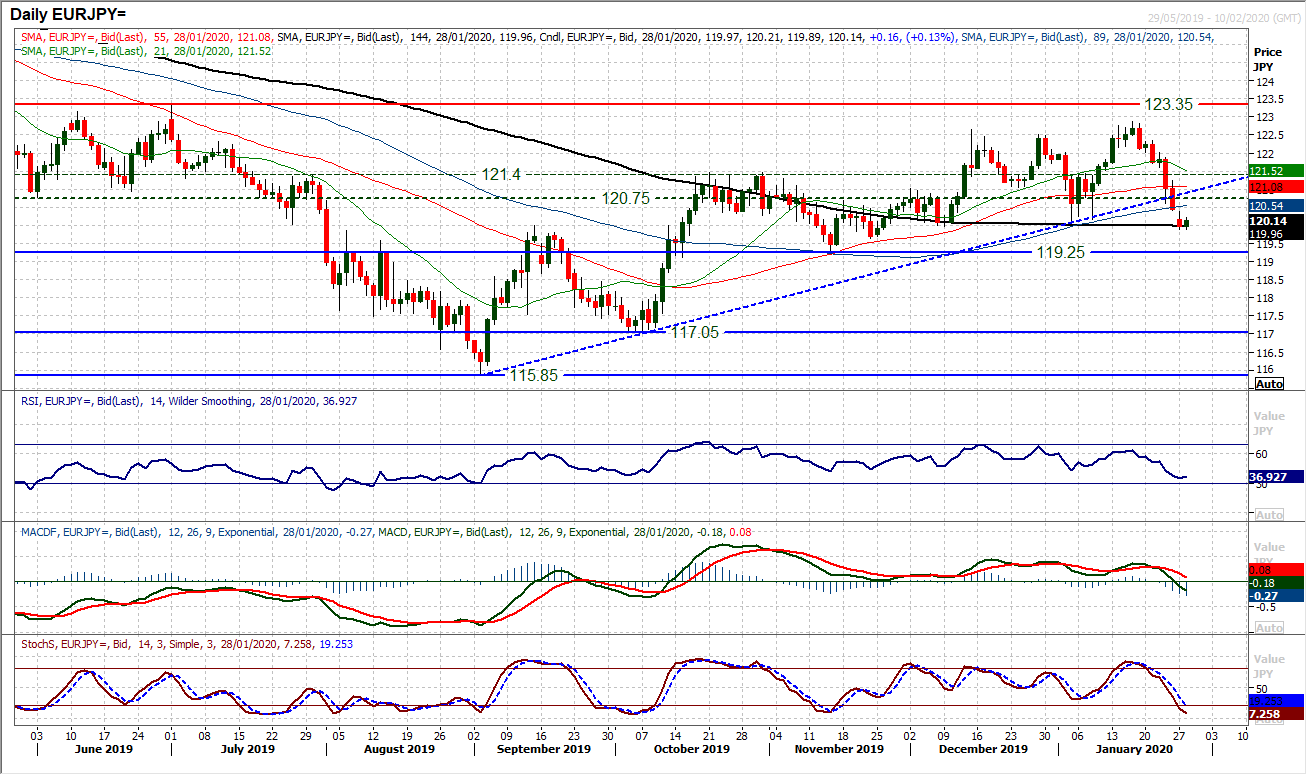
The flight to safety has come just as the euro has been hit by a dovish ECB. Flow into the yen has come as the euro has been pressured. Subsequently, the net impact on EUR/JPY has been for an accelerated sell-off. The move is now breaking some key technical levels in outlook changing moves. There has been a huge deterioration in outlook in just the past seven sessions, with hugely bearish candles. Breaking the support of a near five month uptrend on Friday, the market continued to decline and has now confirmed a breach of the first key higher low of the bull run. Coming with the RSI below 40 at a five month low, and acceleration lower on Stochastics, there is a new negative outlook taking hold. Rallies now look to be a chance to sell. There is a pivot band 120.75/121.40 but it was interesting to see yesterday’s gap down being bearishly filled at 120.40. Further weakness towards 119.25 is likely now.
WTI Oil
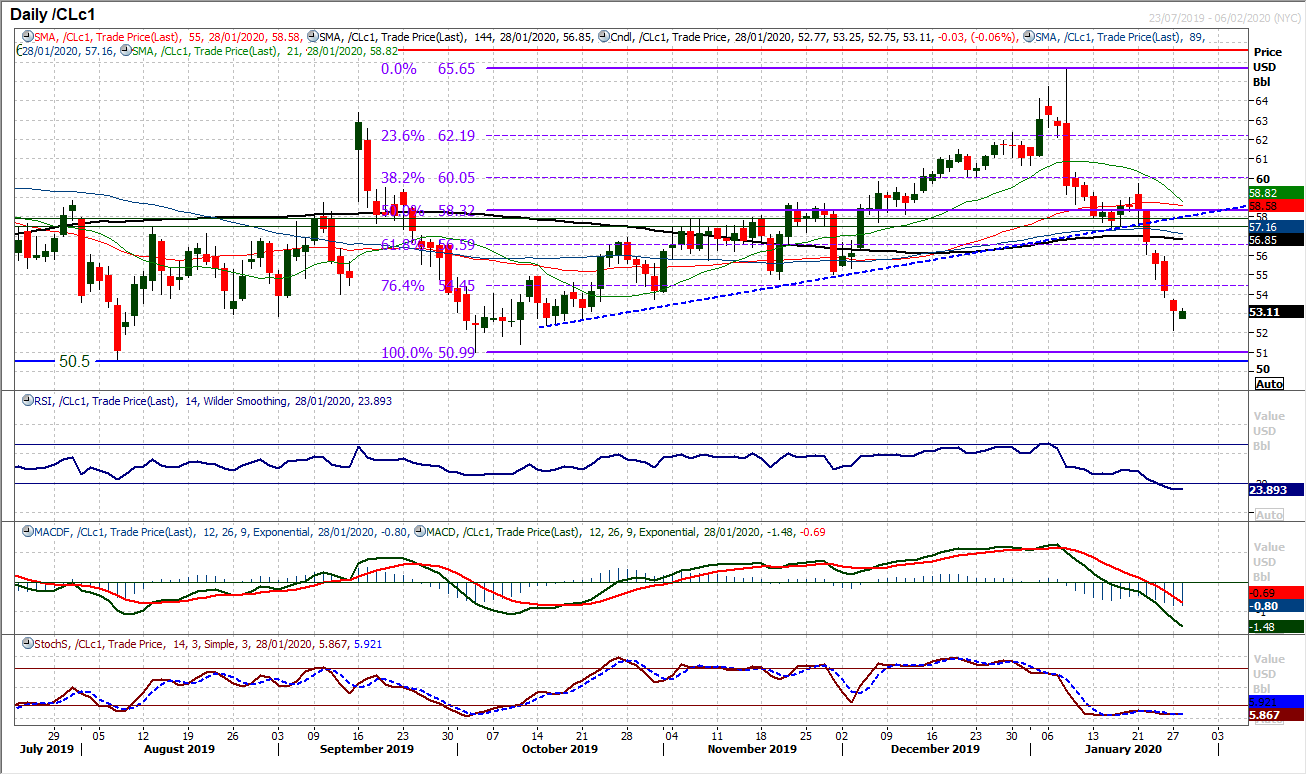
After such a mammoth sell-off in such a short space of time, there is likely to be some kick-back from the bulls at some stage. So how they respond to this morning’s mild rebound will be interesting. If the course of the past week there has been very little, even on an intraday basis, for the bulls to believe could be a recovery. With the daily RSI in the mid-20s (7 month lows), there is a degree of support forming in a stretched market. The hourly chart shows how the bulls have defended $52.15 over the past 24 hours, but now they need to start breaking resistance. Initially, this means $53.90/$54.75 is a barrier to overcome. However, closing with a bull candle today would also help. It is very early days, but for the first time in a week, there could be light at the end of the tunnel for the bulls. Crucial long term support on WTI comes in at $50.50/$51.00.
Dow Jones Industrial Average
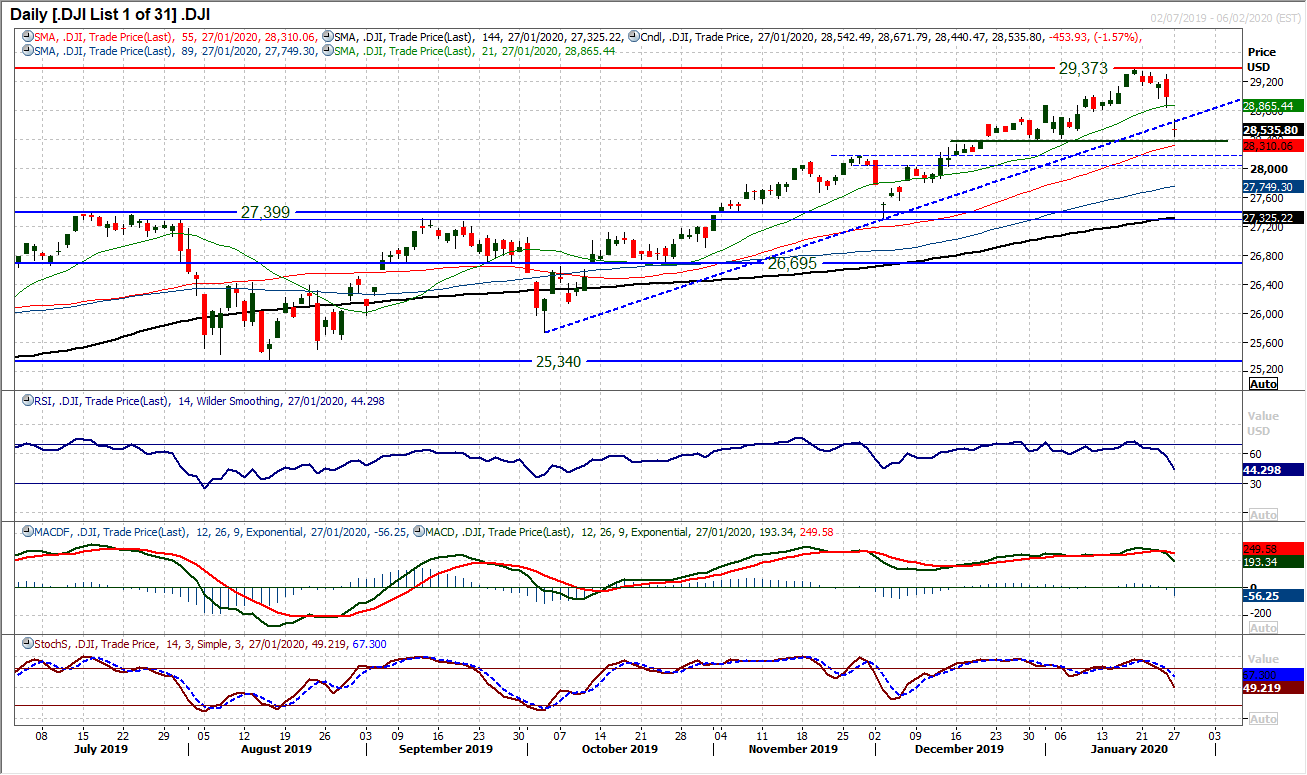
With the elevated fears of the Coronavirus, Wall Street had a lurch to the downside yesterday. A huge gap lower and a close at three week lows. The move has broken a three and a half month uptrend too. The question is now whether this is a move that begins a deeper correction. The important fact for the bulls is that the support of the first key higher low within the old trend higher remains intact. Support at 28,376 will be watched. Also, the Dow occasionally has these little blowouts. Very quick snap sell-offs which last two r three sessions before recovering. This happened early October and early December, and each time the bulls regathered themselves to go again. There is a gap open at 28,843 and how the market reacts to this gap now could be key. If it is left open then it could be a breakaway gap for the beginning of a correction. A doji candle in yesterday’s session suggests a degree of indecision too. A close below 28,376 would also suggest a bigger move lower.
Other assets insights
EUR/USD Analysis: read now
GBP/USD Analysis: read now
USD/JPY Analysis: read now
GOLD Analysis: read now
Author

Richard Perry
Independent Analyst
Richard Perry, Independent Market Analyst, has over 20 years of experience working in financial markets in London.