|

RTY_F (Russell 2000) forecasting the bounce from blue box

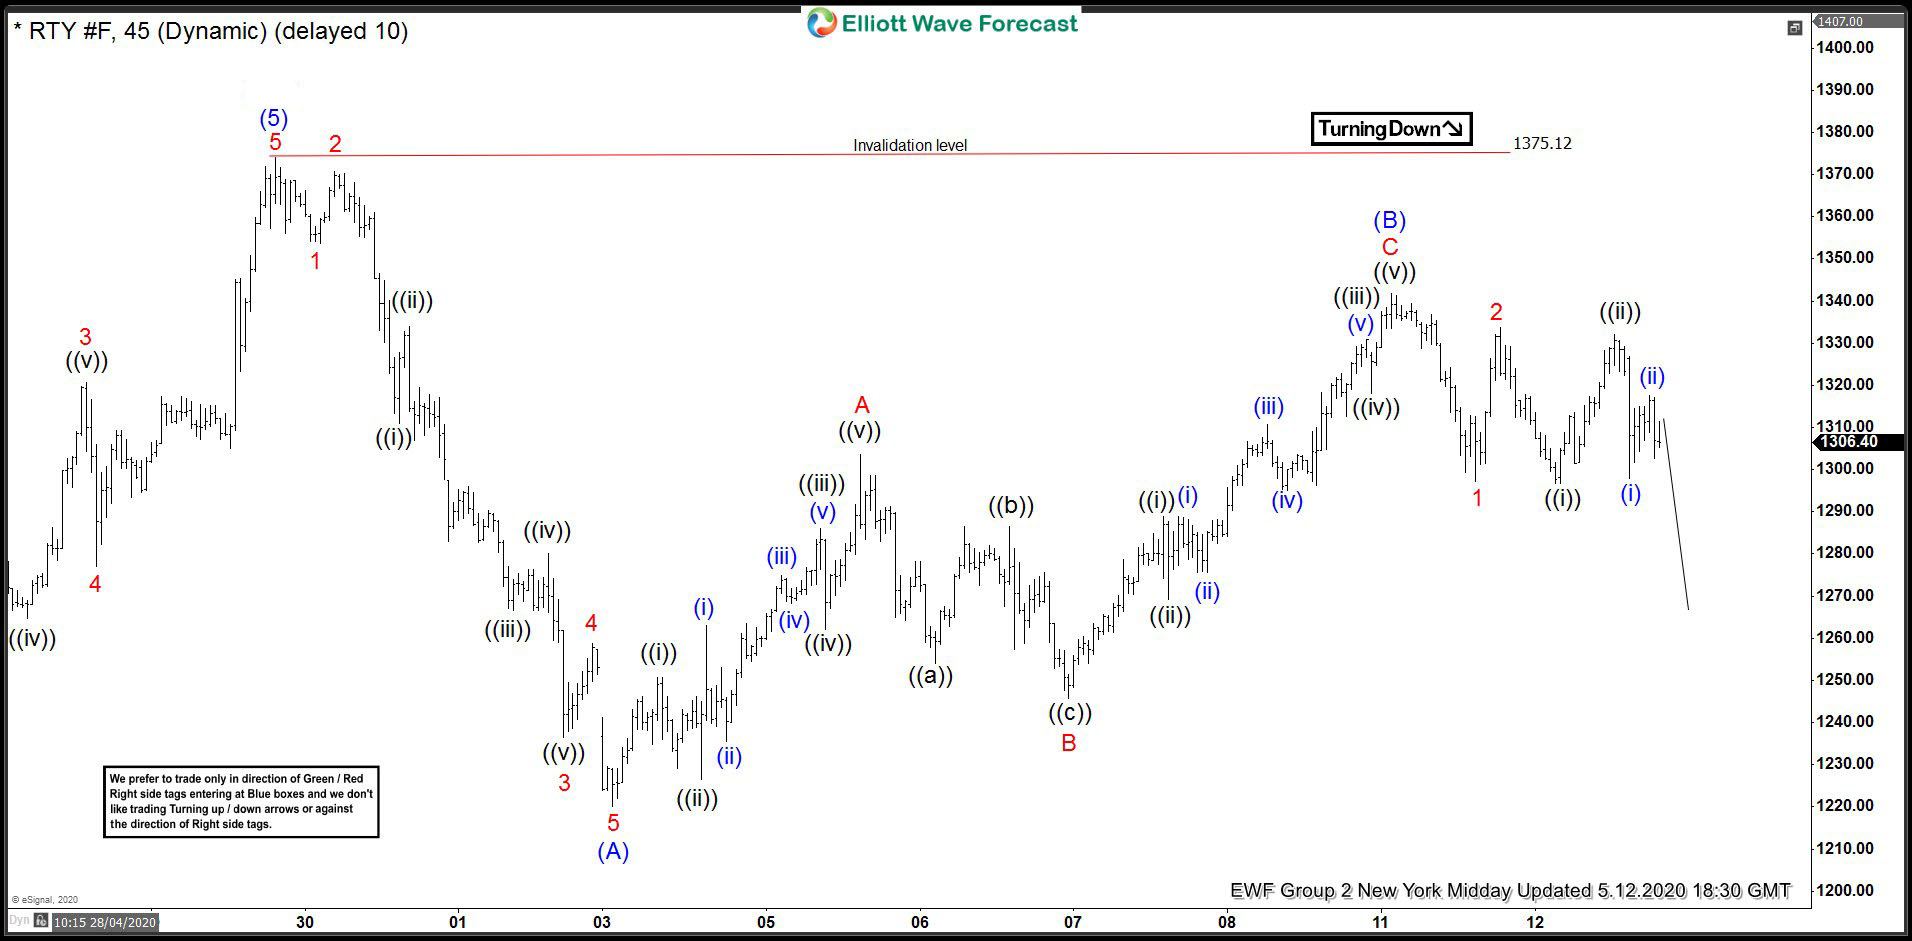
In this blog, we are going to take a look at the Elliott Wave chart of RTY_F (E-mini Russell 2000). The 1 hour NY Midday chart update shows that the cycle from April 29 peak is unfolding as a zig-zag pattern. Wave (A) ended at 1220.1 low and wave (B) bounce ended at 1341.7 high. While below 1375.12 high, the bounce in 3,7 or 11 swing is expected to fail. Since wave (A) unfolded as 5 waves structure, the index can see another 5 waves leg lower in wave (C).

RTY_F 5.12.2020 1 Hour NY Midday Elliott Wave Update

RTY

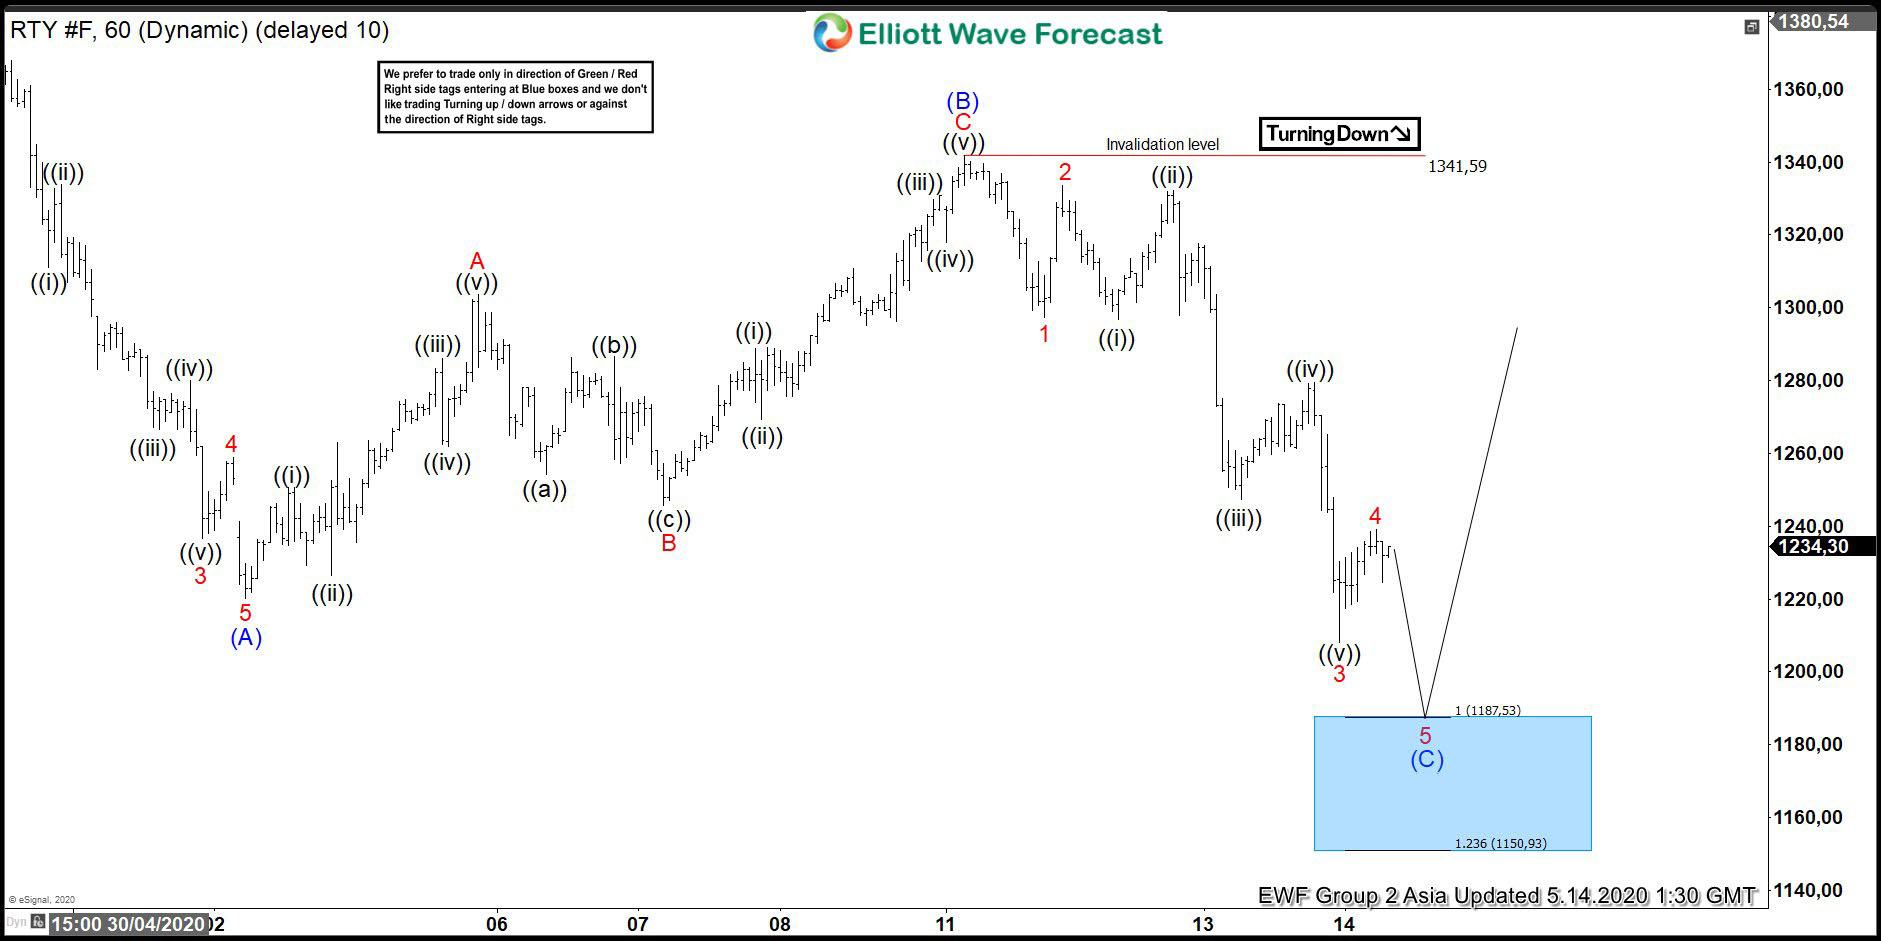
The 1 hour Asia chart update from May 14 shows that the pullback extended lower and broke below previous wave (A) low. The pullback looks incomplete, but is close to ending. The 100% extension of wave (A)-(B) where wave (C) can potentially end is at 1150.93-1187.53 area. This area is shown with a blue box, where we expect buyers to appear for 3 waves bounce at least.

RTY_F 5.14.2020 1 Hour Asia Elliott Wave Update

RTY

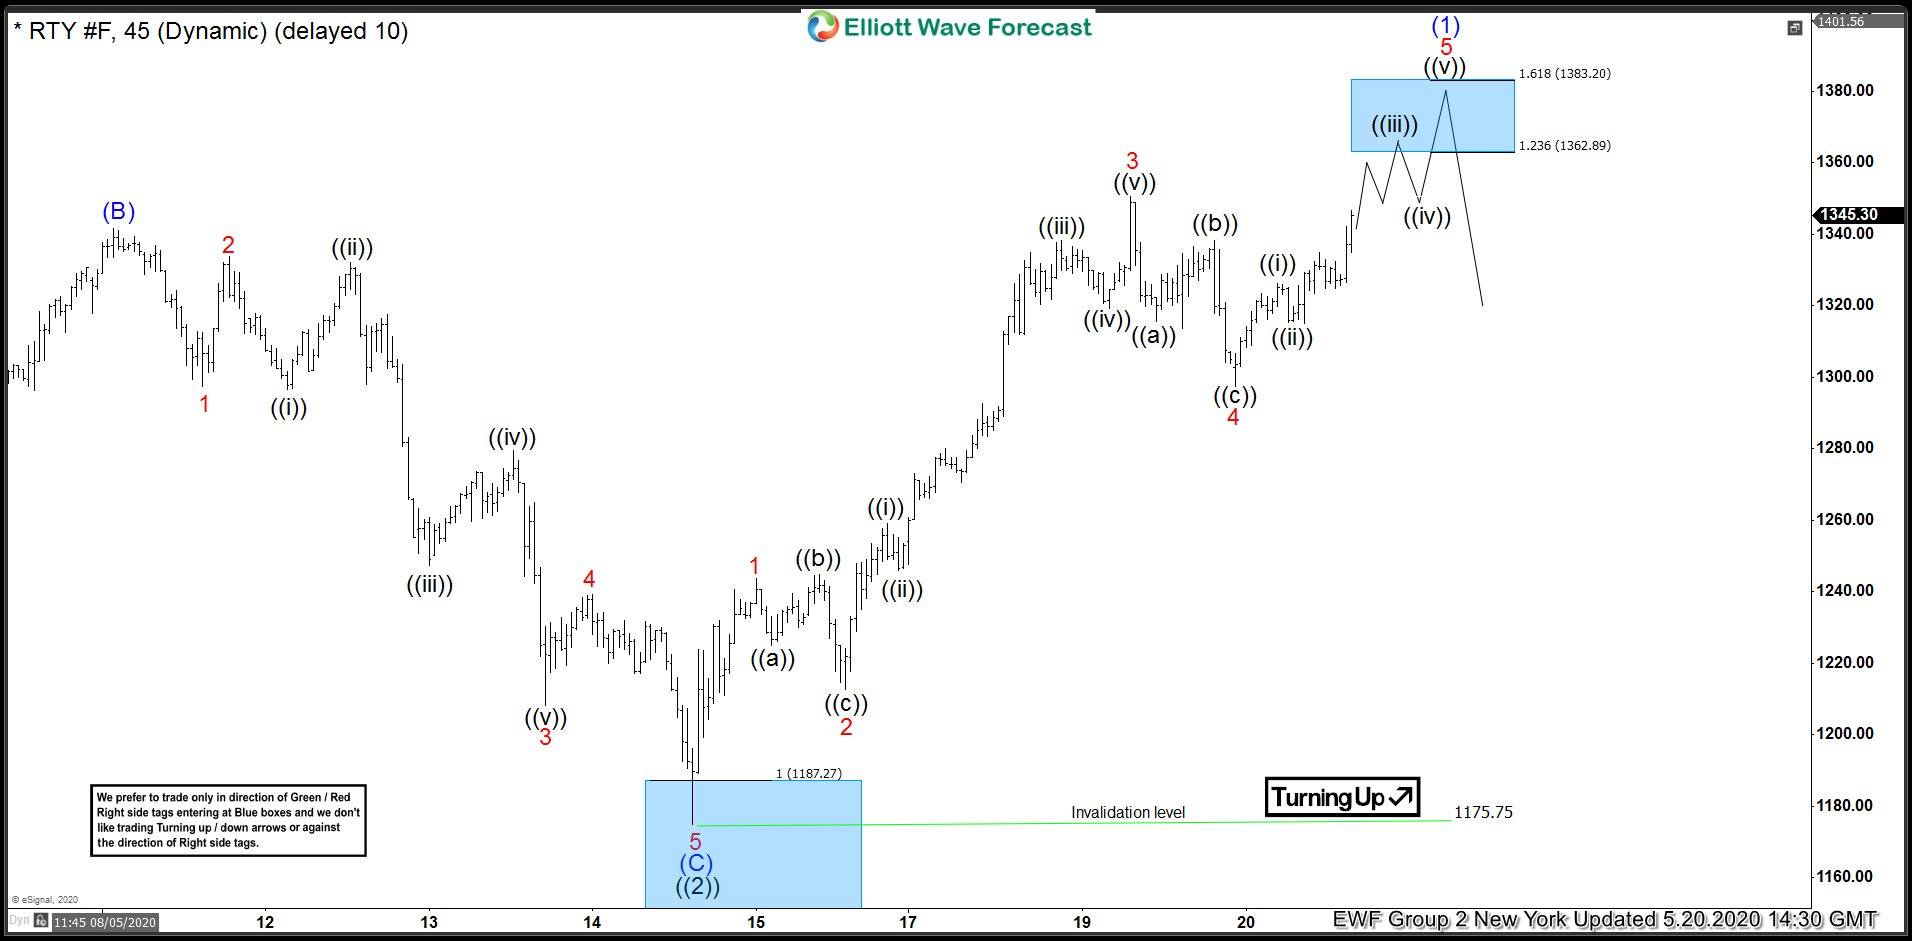
May 21 London chart update shows that the index ended the pullback at the blue box area at 1174.96 low and bounced higher from there. Wave ((i)) ended at 1243.6 high. Wave ((ii)) ended as a flat correction at 1212.60 low. From there, the index pushed higher and ended wave ((iii)) at 1350.7 high. Wave ((iv)) pullback ended at 1297.5 low. Afterwards, wave ((v)) ended at 1354.2 high. Currently, RTY_F has ended the cycle from May 14 low. The index is now expected to pullback in 3,7 or 11 swings before extending for another leg higher in wave C. The index still needs to break above April 29 peak to confirm that the low is in place and to confirm that the next leg up is in progress.

RTY_F 5.20.2020 1 Hour New York Elliott Wave Update

RTY

Author

Elliott Wave Forecast Team

Elliott Wave Forecast Team

ElliottWave-Forecast.com

More from Elliott Wave Forecast Team
Share:

Editor's Picks

EUR/USD looks offered below 1.1900

EUR/USD keeps its bearish tone unchanged ahead of the opening bell in Asia, returning to the sub-1.1900 region following a firmer tone in the US Dollar. Indeed, the pair reverses two consecutive daily gains amid steady caution ahead of Wednesday’s key US Nonfarm Payrolls release.
 

GBP/USD slips back to daily lows near 1.3640

GBP/USD drops to daily lows near 1.3640 as sellers push harder and the Greenback extends its rebound in the latter part of Tuesday’s session. Looking ahead, the combination of key US releases, including NFP and CPI, alongside important UK data, should keep the pound firmly in focus over the coming days.

Gold the battle of wills continues with bulls not ready to give up

Gold remains on the defensive and approaches the key $5,000 region per troy ounce on Tuesday, giving back part of its recent two day. The precious metal’s pullback unfolds against a firmer tone in the US Dollar, declining US Treasury yields and steady caution ahead of upcoming key US data releases.

Bitcoin's downtrend caused by ETF redemptions and AI rotation: Wintermute

Bitcoin's (BTC) fall from grace since the October 10 leverage flush has been spearheaded by sustained ETF outflows and a rotation into the AI narrative, according to Wintermute.

Dollar drops and stocks rally: The week of reckoning for US economic data

Following a sizeable move lower in US technology Stocks last week, we have witnessed a meaningful recovery unfold. The USD Index is in a concerning position; the monthly price continues to hold the south channel support.

XRP holds $1.40 amid ETF inflows and stable derivatives market

Ripple trades under pressure, with immediate support at $1.40 holding at the time of writing on Tuesday. A recovery attempt from last week’s sell-off to $1.12 stalled at $1.54 on Friday, leading to limited price action between the current support and the resistance.