Risk recovery stalls as markets begin to consolidate

Market Overview
Very little has changed in the trade dispute. Yesterday we saw a risk rally, born out of the announcement that low level officials between the US and China are set to meet again at the end of August. If this sounds tenuous, it is probably because it is, and probably hence why the recovery has stalled this morning and markets are consolidating. Yesterday’s rebound is probably more of a testament to lower levels of liquidity in the summer trading period than a decisive move to recover. Admittedly, the recovery in the Turkish lira continues and this is helping to play into the near term rebound, but the move still seems likely to be short-lived. Perhaps in these low liquidity markets, the market moved too far dollar positive and needs to just be reined in a touch and that is what we are seeing as Wall Street pulled sharply higher again. However, watch the movement on the Dollar/Yuan charts as there was a sharp unwind from 6.95 to 6.85, but this move is beginning to stutter this morning. US yields still lack direction, whilst the widening core/periphery spread in Eurozone bonds is also something to keep an eye on. Although Turkey may be slipping out of the headlines as the lira ticks higher, there is still real concern for the US/China trade dispute, something that talks about having talks between low level trade officials will not solve quickly. This feels to be mere period of respite in the recent trend of risk off, dollar strength.

Wall Street closed decisively higher with the S&P 500 +0.8% higher at 2840, whilst futures show little direction this morning. Asian markets have been mixed to slightly positive today with the Nikkei +0.4%, however, European markets have lost their recovery impetus this morning and are trading mildly lower in early moves. In forex, there is a touch of dollar weakness across the majors, but the move seems to be fairly limited currently. Similarly, this consolidation is seen in commodities, with gold just a dollar higher and oil again with limited direction.
Traders will be watching out for the final reading of Eurozone inflation for July which is expected to confirm the flash readings, with headline inflation of +2.1% (+2.1% flash, up from +2.0% last month) and core inflation at +1.1% (+1.1% flash up from +0.9% last month. Canadian inflation is at 1330BST and is expected to show headline CPI at 2.5% (+2.5% last month).
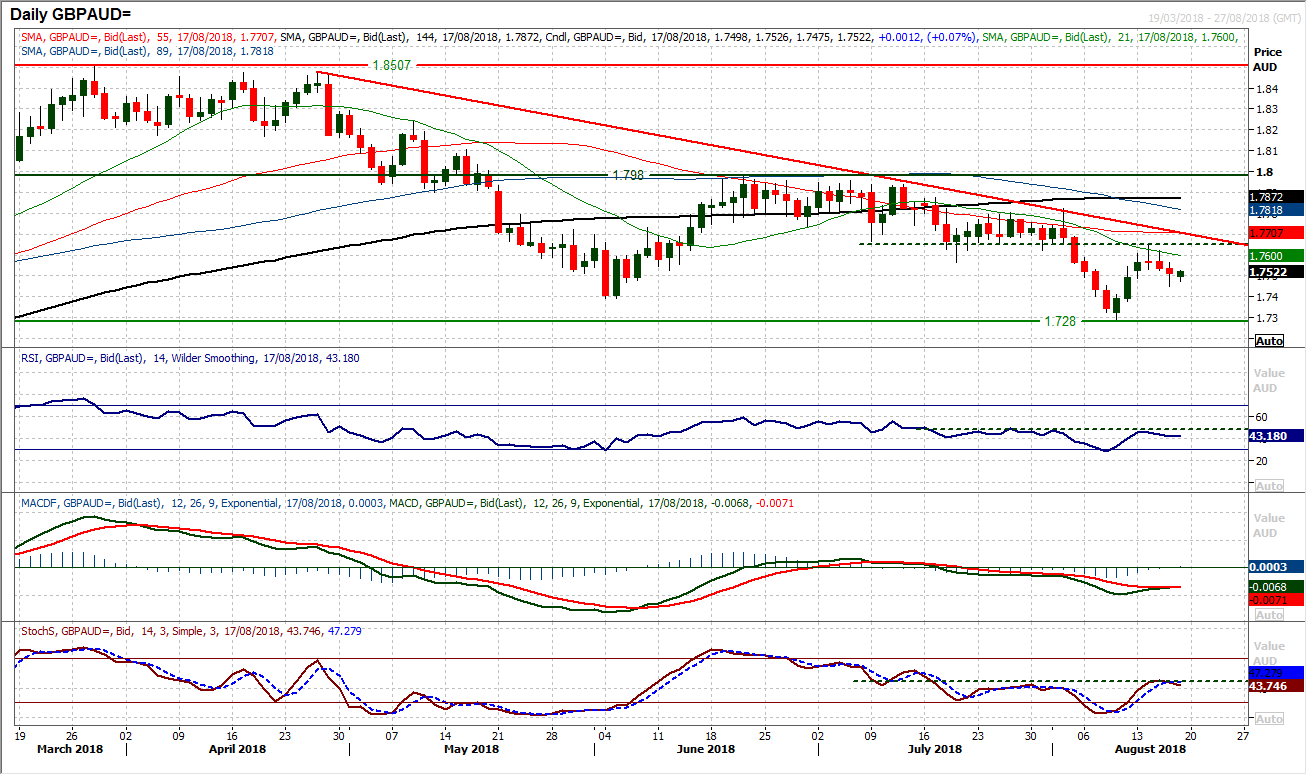
Chart of the Day – GBP/AUD
Sterling continues to look like the ailing member of the forex majors and this is even the case against the Aussie dollar. GBP/AUD broke a series of support on the early August sell-off as the key 1.7390 June low was breached. A subsequent rebound has started to roll over again and as sell signals start to come through this is a chance to sell again. The rebound rallied the market to find resistance in the 100 pip band 1.7565/1.7665. A run of renewed bear candles suggests the momentum of this rally has now played out. The RSI has turned lower again around 50, the Stochastics are crossing lower again around neutral and the rebound has unwound to fail around the falling 21 day moving average again (currently 1.7599). Intraday rallies such as the one seen this morning now seem to be a chance to sell once more within the continuation of a there and a half month downtrend. This all sets up for a retest of the August low at 1.7280 and then potentially the old medium to long term pivot around 1.7100. Above 1.7655 would question the selling strategy, but a breach of the downtrend is needed to change the bearish outlook now.
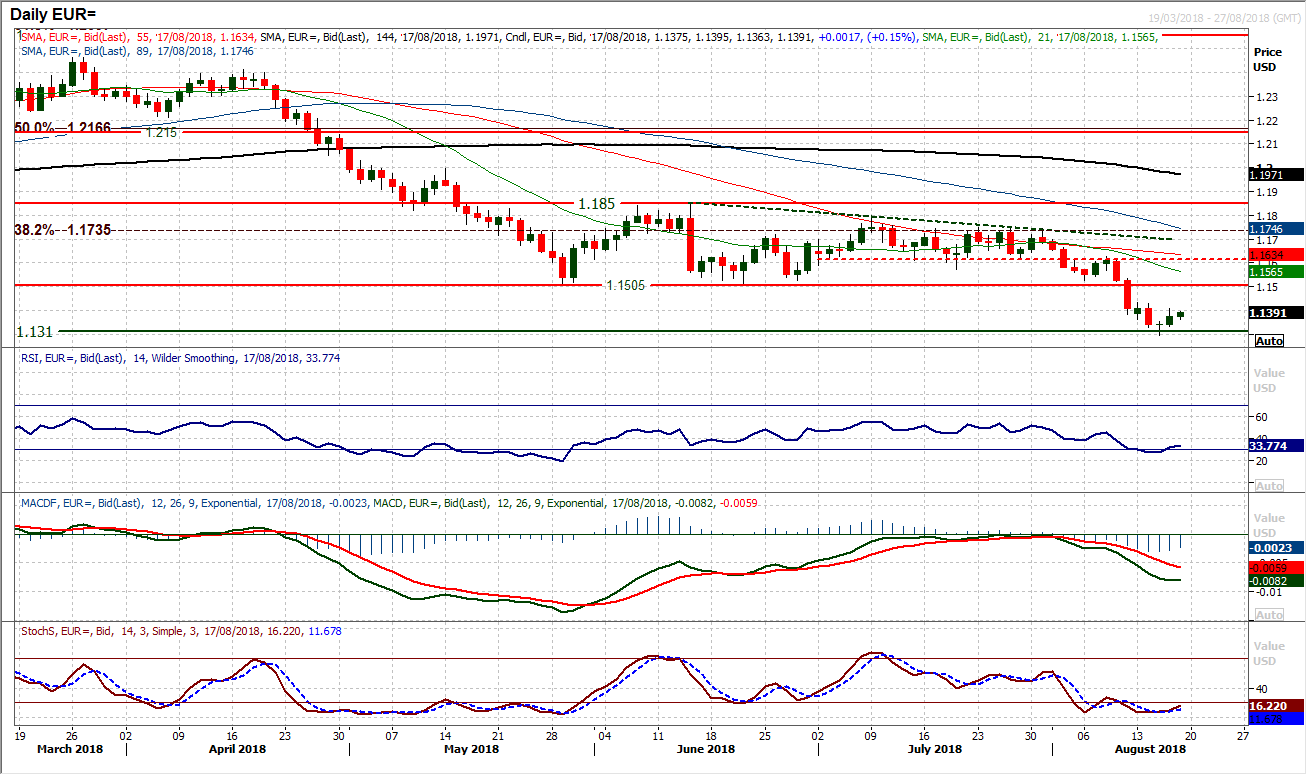
The euro has edged in a recovery higher in recent days, but there is a lack of conviction in the move. The medium term outlook remains decisively bearish and rallies remain a chance to sell. This has been the case since the decisive break down below support at $1.1505 a week ago. Subsequently, there is a band of overhead supply around the $1.1500 level and the tentative rebound on the pair is doing little to suggest there is a sustainable recovery underway that will change that outlook. Momentum indicators remain negatively configured, with the MACD and Stochastics still bearish, whilst the RSI ticking above 30 has lacked intent. The hourly chart shows resistance initially around $1.1430 and this looks to be an unwinding move that is renewing downside potential for a retest of the recent low around $1.1300. The next band of support is $1.1100/$1.1280.
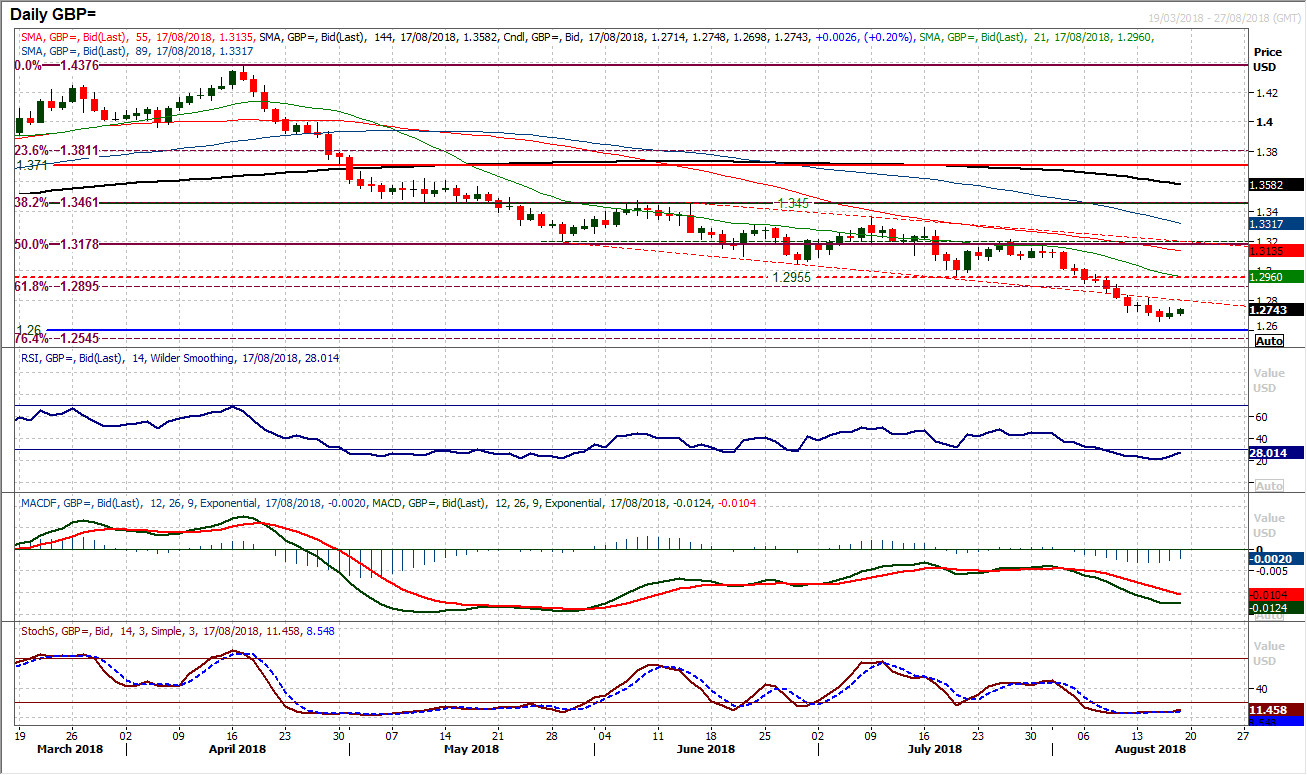
There has been a slight move against the dollar across the majors, but this move is barely registering on Cable. A very mild positive candle added 20 pips yesterday, but on the technicals there is almost nothing still to go on for the bulls. The daily chart shows the old downtrend channel was a basis of resistance earlier in the week, coming in around $1.2800 and may allow an unwind, but aside from the slightest tick higher on the RSI, momentum indicators are hardly registering the move higher from Wednesday’s $1.2660 low at all. The first real resistance is a lower high at $1.2825, whilst the hourly chart shows this move is simply helping to unwind oversold momentum and renew downside potential. There is little to suggest there will not be a retest of $1.2660 with the next real support around $1.2600 from an old pivot from mid-2017.
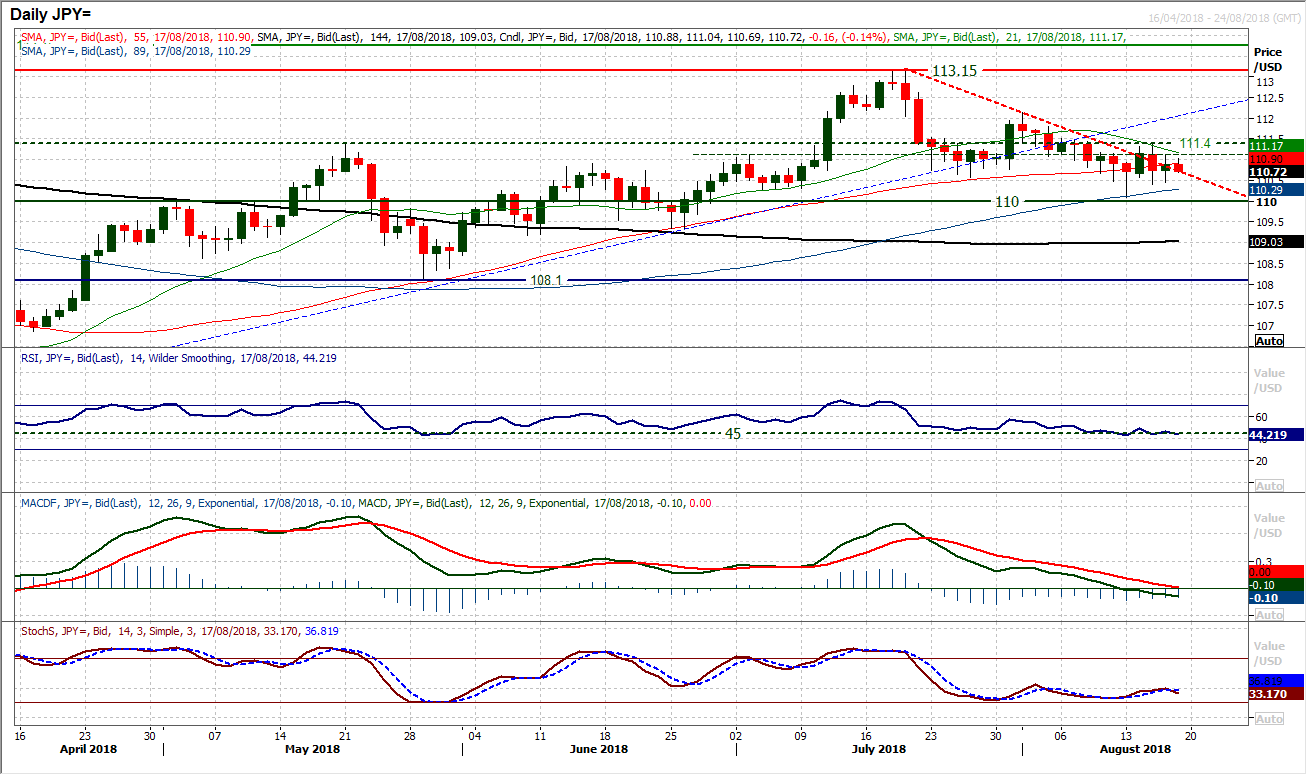
The corrective three week downtrend has been broken as the market continues to throw out conflicting candles as part of a consolidation. There is the slightest negative bias that can be drawn from the momentum indicators, but there is support in the range 110.00/110.60 now and whilst this holds there is little real negative intent. Equally though, the bulls have been unable to regain any real footing in the market either. The MACD lines seem now to be gradually plateauing around neutral, whilst the RSI is just hanging on to 45 again as a level where support forms. Resistance is at 111.40/50 again, with 112.15 a key near term lower reaction high. Still a market in limbo.
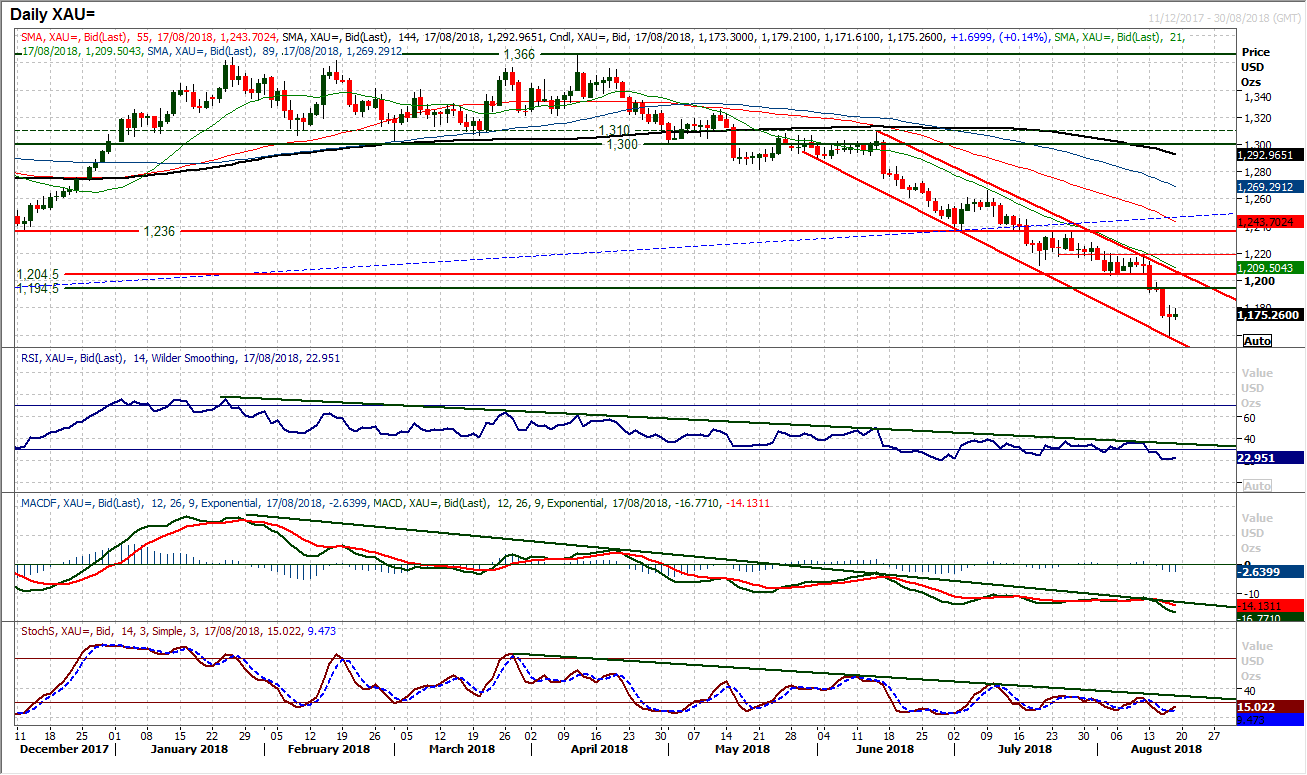
Gold
For much of yesterday it looked as though there would be a solid bull hammer candle forming as the market decisively rebounded off $1160 to close higher on the day. However the bulls lost some of their control into the close and the impetus in the rally seems to be petering out this morning. Gold remains a sell into strength within the downtrend channel of the past two months. The old support becomes new resistance in this, and therefore there is a key band of overhead supply between $1194/$1204. Momentum indicators continue in negative configuration an rallies are likely to continue to fade. Expect a retest of $1160 again, whilst there is little real support until the December 2016 low at $1122. The hourly chart shows the hourly RSI again failing around the mid-50s, MACD lines struggling under neutral and initial resistance now $1182.
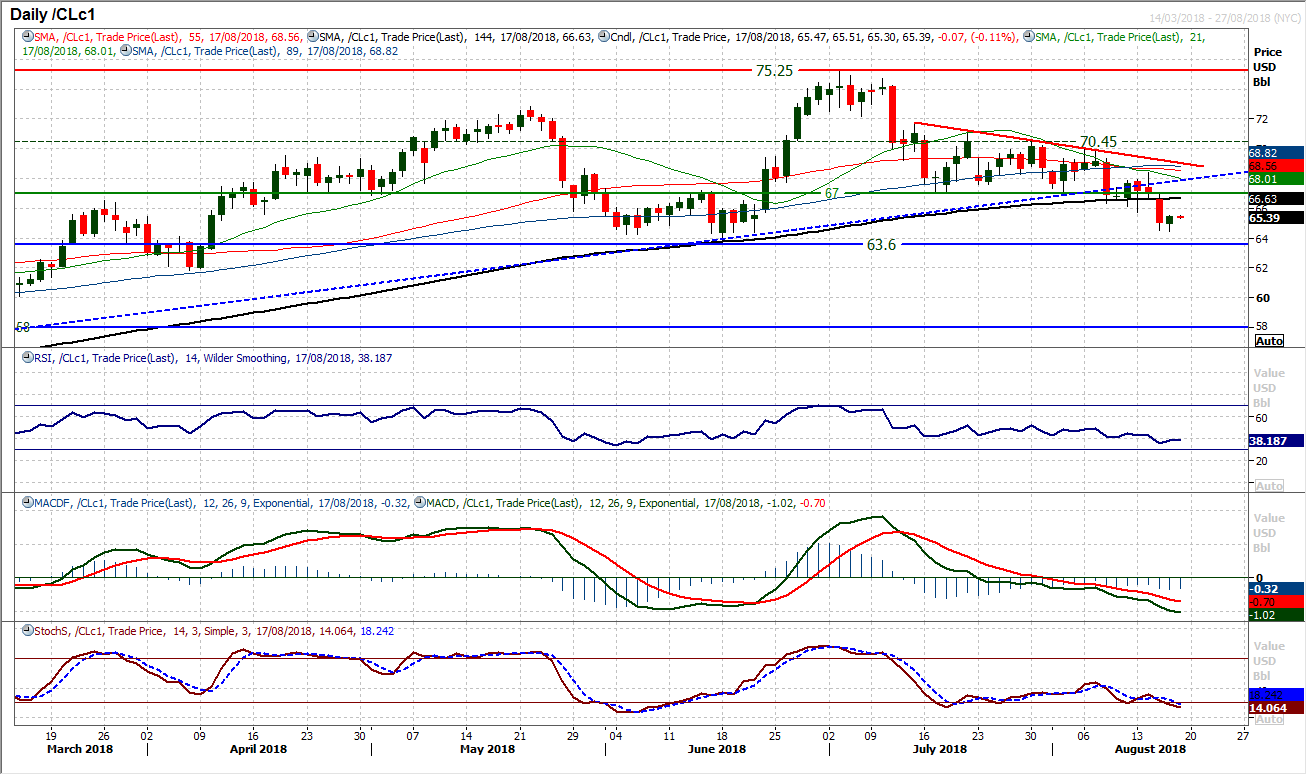
WTI Oil
Oil ticked mildly higher amid the risk rally seen across markets yesterday. A small positive candlestick, however, merely looks to be unwinding some of the selling pressure of recent sessions, rather than engaging the early stages of a recovery. There is potential scope for a rebound towards the pivot around $67, but this could now limit any recovery. This pivot at $67 is now a basis of resistance now as the outlook is now one of selling into strength. This comes with the negative medium term configuration now on momentum, with the RSI under 40, MACD lines still falling away under neutral and Stochastics negatively positioned, but also barely registering the move higher yesterday. There is a basis of resistance now $65.70/$67.00 which is likely to be a cap to a near term rally and a retest of the low at $63.60 seems to be likely in due course. Initial support comes with yesterday’s low of $64.45.
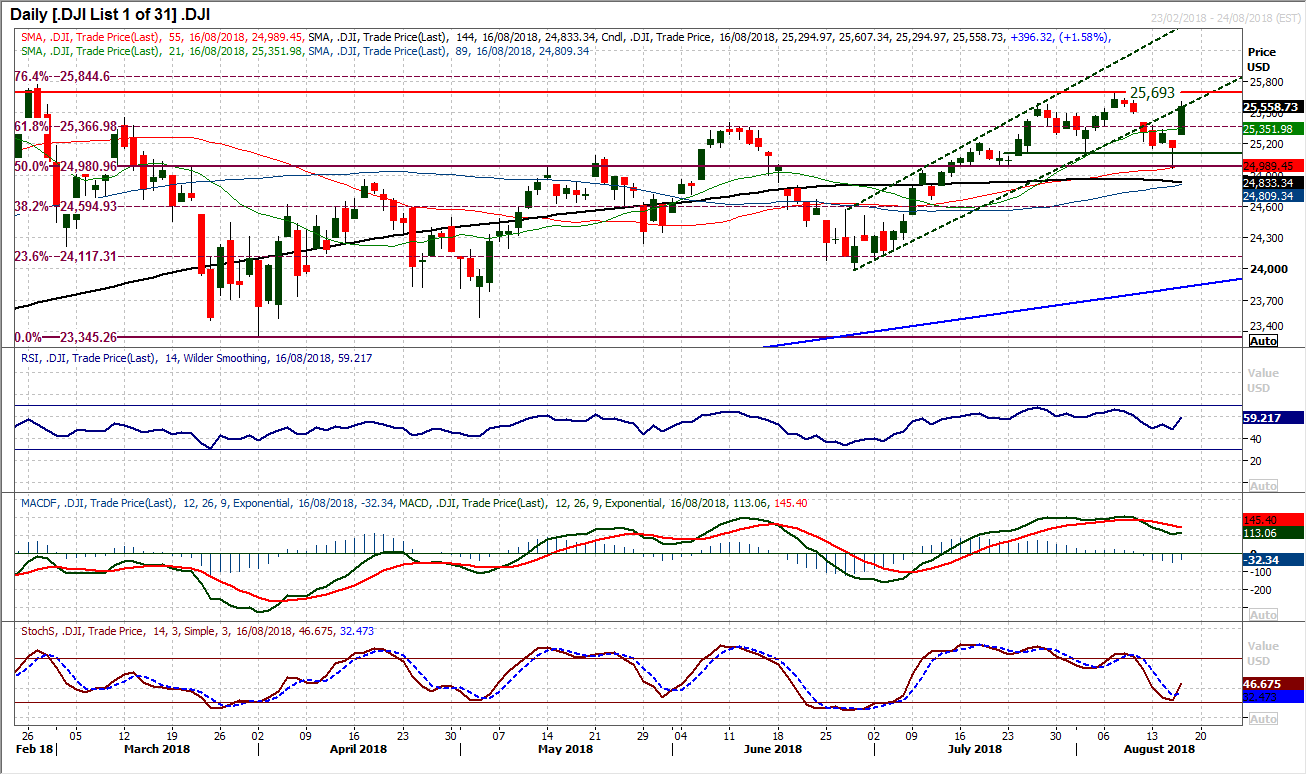
Dow Jones Industrial Average
The bulls really followed through on their intraday rebound on Wednesday with a hugely impressive bullish session yesterday (even if the move was driven largely by gains on Boeing and Caterpillar). A big bull candle has shifted the near term sentiment once more, but the underside of the old uptrend channel has been a basis of resistance (coming in at 25,600 today). The August high of 25,693 is also clearly a key resistance point, but the bulls are suddenly looking far more well set. This could all be part of the thin markets of summer trading, but from having been looking rather precarious, suddenly the bulls are eyeing an upside breakout again. Support has been left at 24,965, around the 50% Fib level at 24,980 and the move straight through the 61.8% Fib (leaving 25,367 as a basis of support) and opens 76.,4% Fib at 24,845 again. The one main caveat is that market reaction seem to be increasingly volatile and means positioning with conviction becomes increasingly difficult.
Author

Richard Perry
Independent Analyst


